-
 Welcome to affLIFT!
We are happy you have decided to check out our awesome affiliate marketing forum. Register your account today to join our amazing community!

GEO: LatAm, CIS. Payment Models: CPA / SPEND / RS / HYBRID. Predict your CPA rate with PIN-UP Partners
You are using an out of date browser. It may not display this or other websites correctly.
You should upgrade or use an alternative browser.
You should upgrade or use an alternative browser.
Step 10 - Analyzing Your PopAds Campaigns using BeMob
- Thread starter Luke
- Start date


AMS
Lurker
- Joined
- Apr 8, 2023
- Messages
- 2
I have a small weird results issue, I spent 5$ and as per popads it spent 5.67$ but in bemob the cost is 17.99$


I don't know why the cost in bemob is more than the spent in PopAds
the conversations count is the same with mobipium even the clicks is much less

I checked with the support they mention that the cost data can be updated manually https://docs.bemob.com/en/update-traffic-cost
Should I update the cost or if there any other parameters are wrong ?
I don't know why the cost in bemob is more than the spent in PopAds
the conversations count is the same with mobipium even the clicks is much less
I checked with the support they mention that the cost data can be updated manually https://docs.bemob.com/en/update-traffic-cost
Should I update the cost or if there any other parameters are wrong ?
- Joined
- Apr 17, 2018
- Messages
- 25,905
I would update the cost. This is a fairly common issue.Should I update the cost or if there any other parameters are wrong ?
- Joined
- Apr 9, 2019
- Messages
- 2,744
Check referrer and referrer domains. Also you can update cost manually. You can prevent it in upcoming campaigns as explained here
cryptomania
Lurker
- Joined
- Jun 3, 2023
- Messages
- 8
- Joined
- May 22, 2018
- Messages
- 231
Hi @cryptomania
Looks like you're referring to the referrers issue which is already mentioned above.
Please contact BeMob support for this - we will assist you with filtering the incorrect referrers and updating the cost data
The support can be reached via live chat
")
- Joined
- Apr 9, 2019
- Messages
- 2,744
cryptomania
Lurker
- Joined
- Jun 3, 2023
- Messages
- 8
Thanks a lot for your help !Hi @cryptomania
Looks like you're referring to the referrers issue which is already mentioned above.
Please contact BeMob support for this - we will assist you with filtering the incorrect referrers and updating the cost data
The support can be reached via live chat
cryptomania
Lurker
- Joined
- Jun 3, 2023
- Messages
- 8
Thanks @Akahma, I will check out !and here is exactly step by step how to deal with this
bobito1876
Lurker
- Joined
- May 20, 2023
- Messages
- 6
First thingAnalyzing Your PopAds Campaigns using BeMob
As I mentioned earlier, I do not expect this campaign to be profitable within our $10 budget. Very rarely will you be profitable with your initial testing. Instead, the initial testing phase of an affiliate marketing campaign is specifically to gather data on how an audience performs with a particular affiliate offer.
Your goal for your initial testing of an affiliate campaign is to simply get conversions. Without conversions, our data is basically just telling us “this is not going to work.”
Once you have some conversions, your data is now telling you “this has some potential.”
This campaign is designed to get you conversions so we have some data we can truly analyze and optimize.
I am happy to say that is exactly what it did
View attachment 6471
My BeMob dashboard shows that with my $5 spent (they only tracked $4.59), I got 16 conversions and made $0.35.
Now, I realize an ROI of -92.30% isn’t overly attractive, but we’ll break it down and see what the data actually tells us.
First though, I want to login to my MOBIPIUM account to make sure they’re also showing 16 conversions.
Something to keep in mind: your tracker, traffic source, and affiliate network may all be on different time zones. This can cause your reports to not match up perfectly, but in most cases, you can set the time zones to whatever you want.
MOBIPIUM uses Lisbon’s time zone (GMT), PopAds lets you set the time zone when you run a report, and you can update the time zone your BeMob tracker uses by going to Settings, Tracker, and time zone is at the top:
View attachment 6472
UTC and GMT are the same thing (they’re on the same time zone).
Anyway, when I login to my MOBIPIUM account, I can see that my conversions match, but there was some click loss:
View attachment 6473
Click loss is common with pop traffic. It basically means that a percent of our clicks are not going to track and get “lost” because the link never finished loading. With pops, this happens a lot when the user exits the pop-up before the landing page loads.
While I love BeMob and their awesome free plan for their tracker, you will see less click loss with a faster tracker (you get what you pay for). But, for what we are trying to do, this is not a big deal.
Breaking down your campaign
We want to run a report for our campaign so we can break it down and see what is working and what is not working. Then, we will make changes according to what the data tells us and spend our last $5 on a more optimize campaign.
In BeMob, click on Campaigns, your campaign name, and then the Report button:
View attachment 6474
The default report is the one I wanted to look at first, our Offers. But, before we dig into it, let’s remove the columns in BeMob that we do not need so we can more easily analyze what we’re seeing.
Click on the Columns button and we’ll remove a bunch of them that we do not need:
View attachment 6475
I’m removing:
All of these are for “Clicks” which we do not have because we are direct linking. When someone clicks a link on your landing page, that is considered a click. We’re direct linking so our “Click” in BeMob is really a Visit.
- Clicks
- Uniq. Clicks
- CPC
- CTR
- UCTR
- CR
- EPC
Once you remove all of those, you will notice that your reports are much easier to read. Now, let’s take a look at how our offers were were split testing performed:
View attachment 6476
They actually performed pretty evenly. Our top converter was Push_Smart_5 at 0.18%. You’ll notice the average payout (AP) is different for each offer. This is because the smartlink pays differently based on whatever country is converting. So, with Push_Smart_5, the conversion rate was the best, but the average payout wasn’t. With this campaign, we should be mainly focused on the conversion rate. We’ll find the offer that converts best and then run it on the countries that are converting best overall.
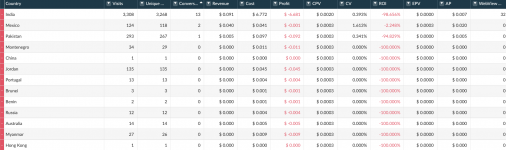
So, let’s also take a look at Countries:
View attachment 6477
Immediately, this report tells me a lot. If you take a look at the top 2 countries listed (sort by Visits by default), you’ll see:
What you may also notice is that while these were our 2 most expensive countries in traffic volume, neither one of them had a conversion.
- India
- Indonesia
So, we spent nearly half our budget on 2 countries without a conversion. Believe it or not, this is actually a good thing. That means we must have some other countries in our list that have some potential!
If you click on the ROI column header, it’ll sort the data based on ROI:
View attachment 6478
These results are interesting. We were profitable in Germany and Sweden without hardly any traffic. South Korea and Thailand also seem to have some potential. Italy, Brazil, and Turkey also all had conversions, but we’ve got a long way to go before we’re going to get those profitable.
One thing to keep in mind with the MOBIPIUM smartlink is that the payouts will vary based on performance. So, ideally, we’d start generating a lot of volume in the GEOs that are close to profitable, do some optimizations, and then we’d also see an increase in payout from MOBIPIUM when our traffic performs well for them. A better strategy would probably be to find more stable sources for higher payouts for these types of offers if you wanted to scale.
Something else to keep in mind is that there are A LOT of countries that we hardly got any traffic in. So, because our initial test was with a low $5 budget, we’re probably missing out on some data.
So far, we’ve analyzed 2 segments of this campaign:
The last one I want to focus on is EXTREMELY important when optimizing any affiliate marketing campaign and that’s the traffic sources variables.
- Offers
- Countries
The traffic source variables are the ones that are automatically tracked by BeMob when we setup the traffic source template earlier.
With PopAds, those are:
View attachment 6479
I call these traffic source variables because these are unique to the traffic source you are working with.
We will be able to analyze and optimize the countries and offers we are promoting on any campaign on any traffic source, but we’re only going to be able to analyze the PopAds WebsiteID on a PopAds campaign.
With PopAds, the two main variables I typically analyze for are:
The WebsiteID is the individual website that is generating the pops that we are buying. Some websites will convert better than others. Especially for specific types of offers.
- WebsiteID
- CategoryID
The CategoryID is the category the website falls within. Remember, earlier we removed all the Adult categories. You’ll find some categories perform better than others for specific types of offers as well.
So, let’s take a look at those two things. Let’s start with the WebsiteID (my favorite):
The BeMob reports for the custom traffic source variables are under the Custom button in the menu:
View attachment 6480
Again, as soon as I open the WebsiteID report, I see some interesting data. The top 3 websites in traffic volume did not convert at all:
View attachment 6481
Let’s find the WebsiteIDs for the websites we did have conversions from. This is a fun report that you should use a lot.
Click on the icon next to Conv. and choose > and click Apply:
View attachment 6482
This report shows that we had 6 profitable WebsiteIDs (that should increase as we do our other optimizations) and if you only include the WebsiteIDs that had conversions, our ROI was only -22%.
View attachment 6483
Learning to run reports like this can be very powerful. There is a lot you can do within BeMob with this type of reporting.
For example, let’s say I wanted to know what countries I was getting conversions from for these WebsiteIDs. When I run that report, I see that I have website that is producing 150% ROI in South Korea:
View attachment 6484
Your initial campaigns are NOT going to be profitable. How do you get your campaigns profitable? You analyze your data just like this.
Before we optimize our campaign, let’s take a look at the CategoryID report we talked about earlier:
View attachment 6485
There is not a whole lot of data here for us to make any changes from and since I already have some changes planned, I am not going to make any changes to the campaign categories.
You don’t want to over optimize your campaign. When you make changes, do them slowly. We need to know how removing a lot of GEOs is going to impact our campaign. If we remove GEOs and Categories, then how do we know which change is positively impacting the campaign?
Based on the data we’ve seen, we should spend our last $5 on this campaign (before we fund it with more money, hopefully) testing specific countries we’re seeing some early results in.
Let’s go back to the Countries report and sort by EPV:
View attachment 6486
Our PopAds CPV is $0.0003 ($0.33 CPM). 4 of the 5 countries shown have an EPV pretty close to our CPV. We should be able to drive more traffic to those countries and collect more data and be almost breakeven or profitable. I want to include Italy as well since we got a nice amount of traffic from Italy and 2 conversions, but our EPV on it is probably too low. Also, based on the volume of traffic we received (about 10% of our total budget), we can probably decrease our CPM in PopAds for Italy and collect more data and potentially get it profitable at a $0.20 CPM instead of $0.33 we’re paying right now.
So, let’s go back to PopAds and optimize our campaign by removing all countries except:
That’s it! We could potentially setup a separate campaign for Italy, but since we only have $5 left in budget, let’s just do this 1 optimization and see how the results are. Then, we can decide if we want to add more budget and keep working on this campaign.
- Germany
- Sweden
- South Korea
- Thailand
NEXT: Step 11 - Optimizing our campaign
The first thing is my Cost, Profit and ROI are incorrect (How do I fix that?)...Here is the rest of my stats for my campaign. What do you think? (What do i do from here?)Analyzing Your PopAds Campaigns using BeMob
As I mentioned earlier, I do not expect this campaign to be profitable within our $10 budget. Very rarely will you be profitable with your initial testing. Instead, the initial testing phase of an affiliate marketing campaign is specifically to gather data on how an audience performs with a particular affiliate offer.
Your goal for your initial testing of an affiliate campaign is to simply get conversions. Without conversions, our data is basically just telling us “this is not going to work.”
Once you have some conversions, your data is now telling you “this has some potential.”
This campaign is designed to get you conversions so we have some data we can truly analyze and optimize.
I am happy to say that is exactly what it did
View attachment 6471
My BeMob dashboard shows that with my $5 spent (they only tracked $4.59), I got 16 conversions and made $0.35.
Now, I realize an ROI of -92.30% isn’t overly attractive, but we’ll break it down and see what the data actually tells us.
First though, I want to login to my MOBIPIUM account to make sure they’re also showing 16 conversions.
Something to keep in mind: your tracker, traffic source, and affiliate network may all be on different time zones. This can cause your reports to not match up perfectly, but in most cases, you can set the time zones to whatever you want.
MOBIPIUM uses Lisbon’s time zone (GMT), PopAds lets you set the time zone when you run a report, and you can update the time zone your BeMob tracker uses by going to Settings, Tracker, and time zone is at the top:
View attachment 6472
UTC and GMT are the same thing (they’re on the same time zone).
Anyway, when I login to my MOBIPIUM account, I can see that my conversions match, but there was some click loss:
View attachment 6473
Click loss is common with pop traffic. It basically means that a percent of our clicks are not going to track and get “lost” because the link never finished loading. With pops, this happens a lot when the user exits the pop-up before the landing page loads.
While I love BeMob and their awesome free plan for their tracker, you will see less click loss with a faster tracker (you get what you pay for). But, for what we are trying to do, this is not a big deal.
Breaking down your campaign
We want to run a report for our campaign so we can break it down and see what is working and what is not working. Then, we will make changes according to what the data tells us and spend our last $5 on a more optimize campaign.
In BeMob, click on Campaigns, your campaign name, and then the Report button:
View attachment 6474
The default report is the one I wanted to look at first, our Offers. But, before we dig into it, let’s remove the columns in BeMob that we do not need so we can more easily analyze what we’re seeing.
Click on the Columns button and we’ll remove a bunch of them that we do not need:
View attachment 6475
I’m removing:
All of these are for “Clicks” which we do not have because we are direct linking. When someone clicks a link on your landing page, that is considered a click. We’re direct linking so our “Click” in BeMob is really a Visit.
- Clicks
- Uniq. Clicks
- CPC
- CTR
- UCTR
- CR
- EPC
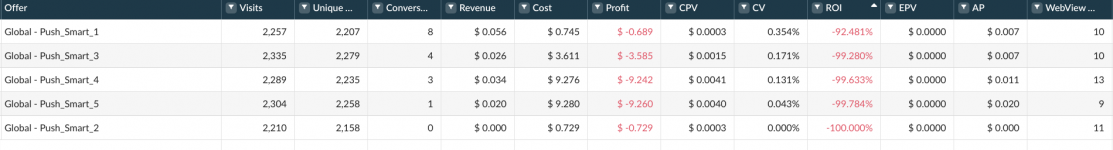
Once you remove all of those, you will notice that your reports are much easier to read. Now, let’s take a look at how our offers were were split testing performed:
View attachment 6476
They actually performed pretty evenly. Our top converter was Push_Smart_5 at 0.18%. You’ll notice the average payout (AP) is different for each offer. This is because the smartlink pays differently based on whatever country is converting. So, with Push_Smart_5, the conversion rate was the best, but the average payout wasn’t. With this campaign, we should be mainly focused on the conversion rate. We’ll find the offer that converts best and then run it on the countries that are converting best overall.
So, let’s also take a look at Countries:
View attachment 6477
Immediately, this report tells me a lot. If you take a look at the top 2 countries listed (sort by Visits by default), you’ll see:
What you may also notice is that while these were our 2 most expensive countries in traffic volume, neither one of them had a conversion.
- India
- Indonesia
So, we spent nearly half our budget on 2 countries without a conversion. Believe it or not, this is actually a good thing. That means we must have some other countries in our list that have some potential!
If you click on the ROI column header, it’ll sort the data based on ROI:
View attachment 6478
These results are interesting. We were profitable in Germany and Sweden without hardly any traffic. South Korea and Thailand also seem to have some potential. Italy, Brazil, and Turkey also all had conversions, but we’ve got a long way to go before we’re going to get those profitable.
One thing to keep in mind with the MOBIPIUM smartlink is that the payouts will vary based on performance. So, ideally, we’d start generating a lot of volume in the GEOs that are close to profitable, do some optimizations, and then we’d also see an increase in payout from MOBIPIUM when our traffic performs well for them. A better strategy would probably be to find more stable sources for higher payouts for these types of offers if you wanted to scale.
Something else to keep in mind is that there are A LOT of countries that we hardly got any traffic in. So, because our initial test was with a low $5 budget, we’re probably missing out on some data.
So far, we’ve analyzed 2 segments of this campaign:
The last one I want to focus on is EXTREMELY important when optimizing any affiliate marketing campaign and that’s the traffic sources variables.
- Offers
- Countries
The traffic source variables are the ones that are automatically tracked by BeMob when we setup the traffic source template earlier.
With PopAds, those are:
View attachment 6479
I call these traffic source variables because these are unique to the traffic source you are working with.
We will be able to analyze and optimize the countries and offers we are promoting on any campaign on any traffic source, but we’re only going to be able to analyze the PopAds WebsiteID on a PopAds campaign.
With PopAds, the two main variables I typically analyze for are:
The WebsiteID is the individual website that is generating the pops that we are buying. Some websites will convert better than others. Especially for specific types of offers.
- WebsiteID
- CategoryID
The CategoryID is the category the website falls within. Remember, earlier we removed all the Adult categories. You’ll find some categories perform better than others for specific types of offers as well.
So, let’s take a look at those two things. Let’s start with the WebsiteID (my favorite):
The BeMob reports for the custom traffic source variables are under the Custom button in the menu:
View attachment 6480
Again, as soon as I open the WebsiteID report, I see some interesting data. The top 3 websites in traffic volume did not convert at all:
View attachment 6481
Let’s find the WebsiteIDs for the websites we did have conversions from. This is a fun report that you should use a lot.
Click on the icon next to Conv. and choose > and click Apply:
View attachment 6482
This report shows that we had 6 profitable WebsiteIDs (that should increase as we do our other optimizations) and if you only include the WebsiteIDs that had conversions, our ROI was only -22%.
View attachment 6483
Learning to run reports like this can be very powerful. There is a lot you can do within BeMob with this type of reporting.
For example, let’s say I wanted to know what countries I was getting conversions from for these WebsiteIDs. When I run that report, I see that I have website that is producing 150% ROI in South Korea:
View attachment 6484
Your initial campaigns are NOT going to be profitable. How do you get your campaigns profitable? You analyze your data just like this.
Before we optimize our campaign, let’s take a look at the CategoryID report we talked about earlier:
View attachment 6485
There is not a whole lot of data here for us to make any changes from and since I already have some changes planned, I am not going to make any changes to the campaign categories.
You don’t want to over optimize your campaign. When you make changes, do them slowly. We need to know how removing a lot of GEOs is going to impact our campaign. If we remove GEOs and Categories, then how do we know which change is positively impacting the campaign?
Based on the data we’ve seen, we should spend our last $5 on this campaign (before we fund it with more money, hopefully) testing specific countries we’re seeing some early results in.
Let’s go back to the Countries report and sort by EPV:
View attachment 6486
Our PopAds CPV is $0.0003 ($0.33 CPM). 4 of the 5 countries shown have an EPV pretty close to our CPV. We should be able to drive more traffic to those countries and collect more data and be almost breakeven or profitable. I want to include Italy as well since we got a nice amount of traffic from Italy and 2 conversions, but our EPV on it is probably too low. Also, based on the volume of traffic we received (about 10% of our total budget), we can probably decrease our CPM in PopAds for Italy and collect more data and potentially get it profitable at a $0.20 CPM instead of $0.33 we’re paying right now.
So, let’s go back to PopAds and optimize our campaign by removing all countries except:
That’s it! We could potentially setup a separate campaign for Italy, but since we only have $5 left in budget, let’s just do this 1 optimization and see how the results are. Then, we can decide if we want to add more budget and keep working on this campaign.
- Germany
- Sweden
- South Korea
- Thailand
NEXT: Step 11 - Optimizing our campaign
Attachments
- Joined
- Apr 9, 2019
- Messages
- 2,744
for the cost issue, you should check this for a permanent solution
- Joined
- Apr 17, 2018
- Messages
- 25,905
Once you fix your cost it will take a few minutes and your stats should adjust I believe.First thing
The first thing is my Cost, Profit and ROI are incorrect (How do I fix that?)...Here is the rest of my stats for my campaign. What do you think? (What do i do from here?)
Analyzing Your PopAds Campaigns using BeMob
As I mentioned earlier, I do not expect this campaign to be profitable within our $10 budget. Very rarely will you be profitable with your initial testing. Instead, the initial testing phase of an affiliate marketing campaign is specifically to gather data on how an audience performs with a particular affiliate offer.
Your goal for your initial testing of an affiliate campaign is to simply get conversions. Without conversions, our data is basically just telling us “this is not going to work.”
Once you have some conversions, your data is now telling you “this has some potential.”
This campaign is designed to get you conversions so we have some data we can truly analyze and optimize.
I am happy to say that is exactly what it did
View attachment 6471
My BeMob dashboard shows that with my $5 spent (they only tracked $4.59), I got 16 conversions and made $0.35.
Now, I realize an ROI of -92.30% isn’t overly attractive, but we’ll break it down and see what the data actually tells us.
First though, I want to login to my MOBIPIUM account to make sure they’re also showing 16 conversions.
Something to keep in mind: your tracker, traffic source, and affiliate network may all be on different time zones. This can cause your reports to not match up perfectly, but in most cases, you can set the time zones to whatever you want.
MOBIPIUM uses Lisbon’s time zone (GMT), PopAds lets you set the time zone when you run a report, and you can update the time zone your BeMob tracker uses by going to Settings, Tracker, and time zone is at the top:
View attachment 6472
UTC and GMT are the same thing (they’re on the same time zone).
Anyway, when I login to my MOBIPIUM account, I can see that my conversions match, but there was some click loss:
View attachment 6473
Click loss is common with pop traffic. It basically means that a percent of our clicks are not going to track and get “lost” because the link never finished loading. With pops, this happens a lot when the user exits the pop-up before the landing page loads.
While I love BeMob and their awesome free plan for their tracker, you will see less click loss with a faster tracker (you get what you pay for). But, for what we are trying to do, this is not a big deal.
Breaking down your campaign
We want to run a report for our campaign so we can break it down and see what is working and what is not working. Then, we will make changes according to what the data tells us and spend our last $5 on a more optimize campaign.
In BeMob, click on Campaigns, your campaign name, and then the Report button:
View attachment 6474
The default report is the one I wanted to look at first, our Offers. But, before we dig into it, let’s remove the columns in BeMob that we do not need so we can more easily analyze what we’re seeing.
Click on the Columns button and we’ll remove a bunch of them that we do not need:
View attachment 6475
I’m removing:
All of these are for “Clicks” which we do not have because we are direct linking. When someone clicks a link on your landing page, that is considered a click. We’re direct linking so our “Click” in BeMob is really a Visit.
- Clicks
- Uniq. Clicks
- CPC
- CTR
- UCTR
- CR
- EPC
Once you remove all of those, you will notice that your reports are much easier to read. Now, let’s take a look at how our offers were were split testing performed:
View attachment 6476
They actually performed pretty evenly. Our top converter was Push_Smart_5 at 0.18%. You’ll notice the average payout (AP) is different for each offer. This is because the smartlink pays differently based on whatever country is converting. So, with Push_Smart_5, the conversion rate was the best, but the average payout wasn’t. With this campaign, we should be mainly focused on the conversion rate. We’ll find the offer that converts best and then run it on the countries that are converting best overall.
So, let’s also take a look at Countries:
View attachment 6477
Immediately, this report tells me a lot. If you take a look at the top 2 countries listed (sort by Visits by default), you’ll see:
What you may also notice is that while these were our 2 most expensive countries in traffic volume, neither one of them had a conversion.
- India
- Indonesia
So, we spent nearly half our budget on 2 countries without a conversion. Believe it or not, this is actually a good thing. That means we must have some other countries in our list that have some potential!
If you click on the ROI column header, it’ll sort the data based on ROI:
View attachment 6478
These results are interesting. We were profitable in Germany and Sweden without hardly any traffic. South Korea and Thailand also seem to have some potential. Italy, Brazil, and Turkey also all had conversions, but we’ve got a long way to go before we’re going to get those profitable.
One thing to keep in mind with the MOBIPIUM smartlink is that the payouts will vary based on performance. So, ideally, we’d start generating a lot of volume in the GEOs that are close to profitable, do some optimizations, and then we’d also see an increase in payout from MOBIPIUM when our traffic performs well for them. A better strategy would probably be to find more stable sources for higher payouts for these types of offers if you wanted to scale.
Something else to keep in mind is that there are A LOT of countries that we hardly got any traffic in. So, because our initial test was with a low $5 budget, we’re probably missing out on some data.
So far, we’ve analyzed 2 segments of this campaign:
The last one I want to focus on is EXTREMELY important when optimizing any affiliate marketing campaign and that’s the traffic sources variables.
- Offers
- Countries
The traffic source variables are the ones that are automatically tracked by BeMob when we setup the traffic source template earlier.
With PopAds, those are:
View attachment 6479
I call these traffic source variables because these are unique to the traffic source you are working with.
We will be able to analyze and optimize the countries and offers we are promoting on any campaign on any traffic source, but we’re only going to be able to analyze the PopAds WebsiteID on a PopAds campaign.
With PopAds, the two main variables I typically analyze for are:
The WebsiteID is the individual website that is generating the pops that we are buying. Some websites will convert better than others. Especially for specific types of offers.
- WebsiteID
- CategoryID
The CategoryID is the category the website falls within. Remember, earlier we removed all the Adult categories. You’ll find some categories perform better than others for specific types of offers as well.
So, let’s take a look at those two things. Let’s start with the WebsiteID (my favorite):
The BeMob reports for the custom traffic source variables are under the Custom button in the menu:
View attachment 6480
Again, as soon as I open the WebsiteID report, I see some interesting data. The top 3 websites in traffic volume did not convert at all:
View attachment 6481
Let’s find the WebsiteIDs for the websites we did have conversions from. This is a fun report that you should use a lot.
Click on the icon next to Conv. and choose > and click Apply:
View attachment 6482
This report shows that we had 6 profitable WebsiteIDs (that should increase as we do our other optimizations) and if you only include the WebsiteIDs that had conversions, our ROI was only -22%.
View attachment 6483
Learning to run reports like this can be very powerful. There is a lot you can do within BeMob with this type of reporting.
For example, let’s say I wanted to know what countries I was getting conversions from for these WebsiteIDs. When I run that report, I see that I have website that is producing 150% ROI in South Korea:
View attachment 6484
Your initial campaigns are NOT going to be profitable. How do you get your campaigns profitable? You analyze your data just like this.
Before we optimize our campaign, let’s take a look at the CategoryID report we talked about earlier:
View attachment 6485
There is not a whole lot of data here for us to make any changes from and since I already have some changes planned, I am not going to make any changes to the campaign categories.
You don’t want to over optimize your campaign. When you make changes, do them slowly. We need to know how removing a lot of GEOs is going to impact our campaign. If we remove GEOs and Categories, then how do we know which change is positively impacting the campaign?
Based on the data we’ve seen, we should spend our last $5 on this campaign (before we fund it with more money, hopefully) testing specific countries we’re seeing some early results in.
Let’s go back to the Countries report and sort by EPV:
View attachment 6486
Our PopAds CPV is $0.0003 ($0.33 CPM). 4 of the 5 countries shown have an EPV pretty close to our CPV. We should be able to drive more traffic to those countries and collect more data and be almost breakeven or profitable. I want to include Italy as well since we got a nice amount of traffic from Italy and 2 conversions, but our EPV on it is probably too low. Also, based on the volume of traffic we received (about 10% of our total budget), we can probably decrease our CPM in PopAds for Italy and collect more data and potentially get it profitable at a $0.20 CPM instead of $0.33 we’re paying right now.
So, let’s go back to PopAds and optimize our campaign by removing all countries except:
That’s it! We could potentially setup a separate campaign for Italy, but since we only have $5 left in budget, let’s just do this 1 optimization and see how the results are. Then, we can decide if we want to add more budget and keep working on this campaign.
- Germany
- Sweden
- South Korea
- Thailand
NEXT: Step 11 - Optimizing our campaign
Thank you so much Luke!Analyzing Your PopAds Campaigns using BeMob
As I mentioned earlier, I do not expect this campaign to be profitable within our $10 budget. Very rarely will you be profitable with your initial testing. Instead, the initial testing phase of an affiliate marketing campaign is specifically to gather data on how an audience performs with a particular affiliate offer.
Your goal for your initial testing of an affiliate campaign is to simply get conversions. Without conversions, our data is basically just telling us “this is not going to work.”
Once you have some conversions, your data is now telling you “this has some potential.”
This campaign is designed to get you conversions so we have some data we can truly analyze and optimize.
I am happy to say that is exactly what it did
View attachment 6471
My BeMob dashboard shows that with my $5 spent (they only tracked $4.59), I got 16 conversions and made $0.35.
Now, I realize an ROI of -92.30% isn’t overly attractive, but we’ll break it down and see what the data actually tells us.
First though, I want to login to my MOBIPIUM account to make sure they’re also showing 16 conversions.
Something to keep in mind: your tracker, traffic source, and affiliate network may all be on different time zones. This can cause your reports to not match up perfectly, but in most cases, you can set the time zones to whatever you want.
MOBIPIUM uses Lisbon’s time zone (GMT), PopAds lets you set the time zone when you run a report, and you can update the time zone your BeMob tracker uses by going to Settings, Tracker, and time zone is at the top:
View attachment 6472
UTC and GMT are the same thing (they’re on the same time zone).
Anyway, when I login to my MOBIPIUM account, I can see that my conversions match, but there was some click loss:
View attachment 6473
Click loss is common with pop traffic. It basically means that a percent of our clicks are not going to track and get “lost” because the link never finished loading. With pops, this happens a lot when the user exits the pop-up before the landing page loads.
While I love BeMob and their awesome free plan for their tracker, you will see less click loss with a faster tracker (you get what you pay for). But, for what we are trying to do, this is not a big deal.
Breaking down your campaign
We want to run a report for our campaign so we can break it down and see what is working and what is not working. Then, we will make changes according to what the data tells us and spend our last $5 on a more optimize campaign.
In BeMob, click on Campaigns, your campaign name, and then the Report button:
View attachment 6474
The default report is the one I wanted to look at first, our Offers. But, before we dig into it, let’s remove the columns in BeMob that we do not need so we can more easily analyze what we’re seeing.
Click on the Columns button and we’ll remove a bunch of them that we do not need:
View attachment 6475
I’m removing:
All of these are for “Clicks” which we do not have because we are direct linking. When someone clicks a link on your landing page, that is considered a click. We’re direct linking so our “Click” in BeMob is really a Visit.
- Clicks
- Uniq. Clicks
- CPC
- CTR
- UCTR
- CR
- EPC
Once you remove all of those, you will notice that your reports are much easier to read. Now, let’s take a look at how our offers were were split testing performed:
View attachment 6476
They actually performed pretty evenly. Our top converter was Push_Smart_5 at 0.18%. You’ll notice the average payout (AP) is different for each offer. This is because the smartlink pays differently based on whatever country is converting. So, with Push_Smart_5, the conversion rate was the best, but the average payout wasn’t. With this campaign, we should be mainly focused on the conversion rate. We’ll find the offer that converts best and then run it on the countries that are converting best overall.
So, let’s also take a look at Countries:
View attachment 6477
Immediately, this report tells me a lot. If you take a look at the top 2 countries listed (sort by Visits by default), you’ll see:
What you may also notice is that while these were our 2 most expensive countries in traffic volume, neither one of them had a conversion.
- India
- Indonesia
So, we spent nearly half our budget on 2 countries without a conversion. Believe it or not, this is actually a good thing. That means we must have some other countries in our list that have some potential!
If you click on the ROI column header, it’ll sort the data based on ROI:
View attachment 6478
These results are interesting. We were profitable in Germany and Sweden without hardly any traffic. South Korea and Thailand also seem to have some potential. Italy, Brazil, and Turkey also all had conversions, but we’ve got a long way to go before we’re going to get those profitable.
One thing to keep in mind with the MOBIPIUM smartlink is that the payouts will vary based on performance. So, ideally, we’d start generating a lot of volume in the GEOs that are close to profitable, do some optimizations, and then we’d also see an increase in payout from MOBIPIUM when our traffic performs well for them. A better strategy would probably be to find more stable sources for higher payouts for these types of offers if you wanted to scale.
Something else to keep in mind is that there are A LOT of countries that we hardly got any traffic in. So, because our initial test was with a low $5 budget, we’re probably missing out on some data.
So far, we’ve analyzed 2 segments of this campaign:
The last one I want to focus on is EXTREMELY important when optimizing any affiliate marketing campaign and that’s the traffic sources variables.
- Offers
- Countries
The traffic source variables are the ones that are automatically tracked by BeMob when we setup the traffic source template earlier.
With PopAds, those are:
View attachment 6479
I call these traffic source variables because these are unique to the traffic source you are working with.
We will be able to analyze and optimize the countries and offers we are promoting on any campaign on any traffic source, but we’re only going to be able to analyze the PopAds WebsiteID on a PopAds campaign.
With PopAds, the two main variables I typically analyze for are:
The WebsiteID is the individual website that is generating the pops that we are buying. Some websites will convert better than others. Especially for specific types of offers.
- WebsiteID
- CategoryID
The CategoryID is the category the website falls within. Remember, earlier we removed all the Adult categories. You’ll find some categories perform better than others for specific types of offers as well.
So, let’s take a look at those two things. Let’s start with the WebsiteID (my favorite):
The BeMob reports for the custom traffic source variables are under the Custom button in the menu:
View attachment 6480
Again, as soon as I open the WebsiteID report, I see some interesting data. The top 3 websites in traffic volume did not convert at all:
View attachment 6481
Let’s find the WebsiteIDs for the websites we did have conversions from. This is a fun report that you should use a lot.
Click on the icon next to Conv. and choose > and click Apply:
View attachment 6482
This report shows that we had 6 profitable WebsiteIDs (that should increase as we do our other optimizations) and if you only include the WebsiteIDs that had conversions, our ROI was only -22%.
View attachment 6483
Learning to run reports like this can be very powerful. There is a lot you can do within BeMob with this type of reporting.
For example, let’s say I wanted to know what countries I was getting conversions from for these WebsiteIDs. When I run that report, I see that I have website that is producing 150% ROI in South Korea:
View attachment 6484
Your initial campaigns are NOT going to be profitable. How do you get your campaigns profitable? You analyze your data just like this.
Before we optimize our campaign, let’s take a look at the CategoryID report we talked about earlier:
View attachment 6485
There is not a whole lot of data here for us to make any changes from and since I already have some changes planned, I am not going to make any changes to the campaign categories.
You don’t want to over optimize your campaign. When you make changes, do them slowly. We need to know how removing a lot of GEOs is going to impact our campaign. If we remove GEOs and Categories, then how do we know which change is positively impacting the campaign?
Based on the data we’ve seen, we should spend our last $5 on this campaign (before we fund it with more money, hopefully) testing specific countries we’re seeing some early results in.
Let’s go back to the Countries report and sort by EPV:
View attachment 6486
Our PopAds CPV is $0.0003 ($0.33 CPM). 4 of the 5 countries shown have an EPV pretty close to our CPV. We should be able to drive more traffic to those countries and collect more data and be almost breakeven or profitable. I want to include Italy as well since we got a nice amount of traffic from Italy and 2 conversions, but our EPV on it is probably too low. Also, based on the volume of traffic we received (about 10% of our total budget), we can probably decrease our CPM in PopAds for Italy and collect more data and potentially get it profitable at a $0.20 CPM instead of $0.33 we’re paying right now.
So, let’s go back to PopAds and optimize our campaign by removing all countries except:
That’s it! We could potentially setup a separate campaign for Italy, but since we only have $5 left in budget, let’s just do this 1 optimization and see how the results are. Then, we can decide if we want to add more budget and keep working on this campaign.
- Germany
- Sweden
- South Korea
- Thailand
NEXT: Step 11 - Optimizing our campaign
I ran my first $5 campaign yesterday and today when I checked BeMob it did not show any conversions but Mobipium showed I had conversions.
I changed my the parameter from trk in the callback and postback to "cid" and ran another $5 for these results. The conversions in both BeMob and Mobipium match so I trust the tracking at this point. My bid was $0.00020
Here are the Websites ID with quite a number them looking good:
Here are my Websites with the most visits and drill down by Country: Although website 4965562 has a -97% ROI, the country Indonesia is at -35% ROI, which I think with further optimization and more budget could reveal more?
Please how will you optimize the countries and the websites at this point from your perspective?
Also I do see the EPV for India, Indonesia and Egypt shows $0.0000 so could I bid less like $0.00010 to hopefully get more conversions?
Thank you so much in advance for your input.
Best regards,
Prosper
- Joined
- Apr 17, 2018
- Messages
- 25,905
I would remove the countries that aren't performing and try to focus on the ones that are. You do not have enough data here to make any decisions on website IDs imo.Please how will you optimize the countries and the websites at this point from your perspective?
Yeah those will be tough since the payouts are so low. You could try thoughAlso I do see the EPV for India, Indonesia and Egypt shows $0.0000 so could I bid less like $0.00010 to hopefully get more conversions?
Thank you so much Luke! I will focus on the countries and see if I can get a bit more data.I would remove the countries that aren't performing and try to focus on the ones that are. You do not have enough data here to make any decisions on website IDs imo.
Yeah those will be tough since the payouts are so low. You could try though
afficio
Super Contributor
- Joined
- Dec 14, 2018
- Messages
- 21
Alright!
Campaign was approved this morning and burned through the $5 budget in about 5 min — which was expected with the bid and targeting that was set.
Goal: Address any issues with data discrepancies prior to optimisation — to have assurance optimisation is done on the basis of accurate data, or as close to accurate as possible.
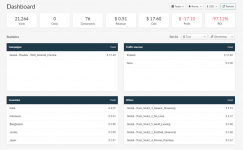
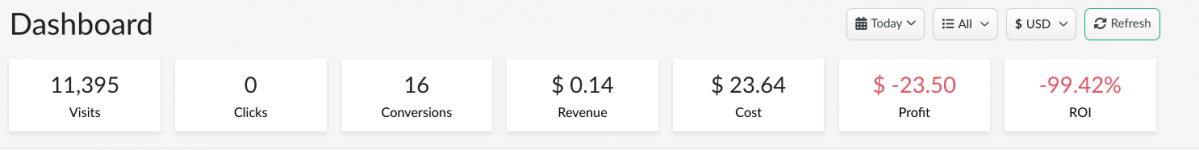
Here's a snapshot (with manually updated metrics to show accurate cost, ROI):

Campaign was approved this morning and burned through the $5 budget in about 5 min
— which was expected with the bid and targeting that was set. Pre-optimisation data 'hygiene' checks
Goal: Address any issues with data discrepancies prior to optimisation — to have assurance optimisation is done on the basis of accurate data, or as close to accurate as possible.| Check | Outcome | Tasks | Comments |
|---|---|---|
| Are conversions between Mobipium and BeMob tracking, and accurate? | Tracking: Yes! Accurate: No (BeMob has 1 less) | Exported the 'Fired Callbacks' report from Mobipium to see what happened with that 1 conversion that didn't make it to BeMob. Turns out 1 didn't have the click ID. But, a possible save here for me is that I decided to pass Mobipium's unique ID {uni} as a transaction ID txid= in my BeMob postback. Task: See if my AM from Mobipium can cross-reference this uni value with a click ID so I can then upload that conversion to BeMob to make it 100% accurate for conversions. |
| Are conversions between BeMob and PopAds tracking, and accurate? | Tracking: Yes! Accurate: Yes! | Missing conversion will be updated once the discrepancy between Mobipium and BeMob is solved. |
| Is cost data between PopAds and BeMob tracking and accurate? | Tracking: Yes! Accurate: No (BeMob reported ~x2 total cost compared to actual PopAds) PopAds: $5.50 BeMob: $11.78 (+ ~114%) | This issue was expected, as mentioned in this and other threads it's due to bot traffic. A means to filter out future bots outlined by @Akahma for different trackers here. As this is after traffic is already collected, filtering isn't applicable here. I was curious what would be the total cost with that known bot excluded from existing report data, so followed these steps to remove the known bot referrer domain 'www.google.com' Campaign report → Referrer Domains → Sort cost column → Exclude NB This exclusion will persist when navigating through views in the individual campaign report context Cost with this exclusion came to $3.25 $2.25/~40% less than the cost on PopAds. Which I assume was due to traffic loss, segueing into my next data 'hygiene' check Task: Use the manual cost update option in BeMob to update the cost to the actual cost from PopAds — $5.50 |
| What's the difference in views in BeMob vs impressions in PopAds? i.e. what's the traffic loss % | - 40.76% PopAds: 18,338 imp. BeMob: 10,867 views | This seems quite high, and not sure if this is actually an expected % loss for PopAds/pops in general?  @Luke or @dood what's your take on this, if any? p.s. I was using https for my BeMob campaign link, with default domain. Task (*tentative): Set the traffic loss % on the traffic source level in BeMob to account for this % (decrease the difference). *tentative, because this campaign was live for a whole 5 mins. which may not be the best sample duration to reference as a basis for correcting the auto cost. |
I'll be back later today to share an update on my analysis of the campaign + optimisations made for the campaign's second run on PopAds.
Here's a snapshot (with manually updated metrics to show accurate cost, ROI):
Last edited:
- Joined
- May 2, 2018
- Messages
- 4,765
- 40.76%
40% seems quite high, but try to check stats by zones - there might be a few bad zones that are causing this high click loss while others might be fine. Once you block those zones, your stats will look better.
Also this might help you:
Last edited:
afficio
Super Contributor
- Joined
- Dec 14, 2018
- Messages
- 21
Thanks @dood ! Appreciate the cue and sharing the helpful post/template from @noisyboy40% seems quite high, but try to check stats by zones - there might be a few bad zones that are causing this high click loss while others might be fine. Once you block those zones, your stats will look better.
Also this might help you:

I'll also expand upon this analysis it to see if there's any difference of % loss for specific zones by geo, or if it's just a global trend.
It's a pity that PopAds has limited data available for export...
More awesome affiliate marketing threads 👇

- Replies
- 395
- Views
- 48K
- Replies
- 1
- Views
- 1K
- Replies
- 3
- Views
- 2K