



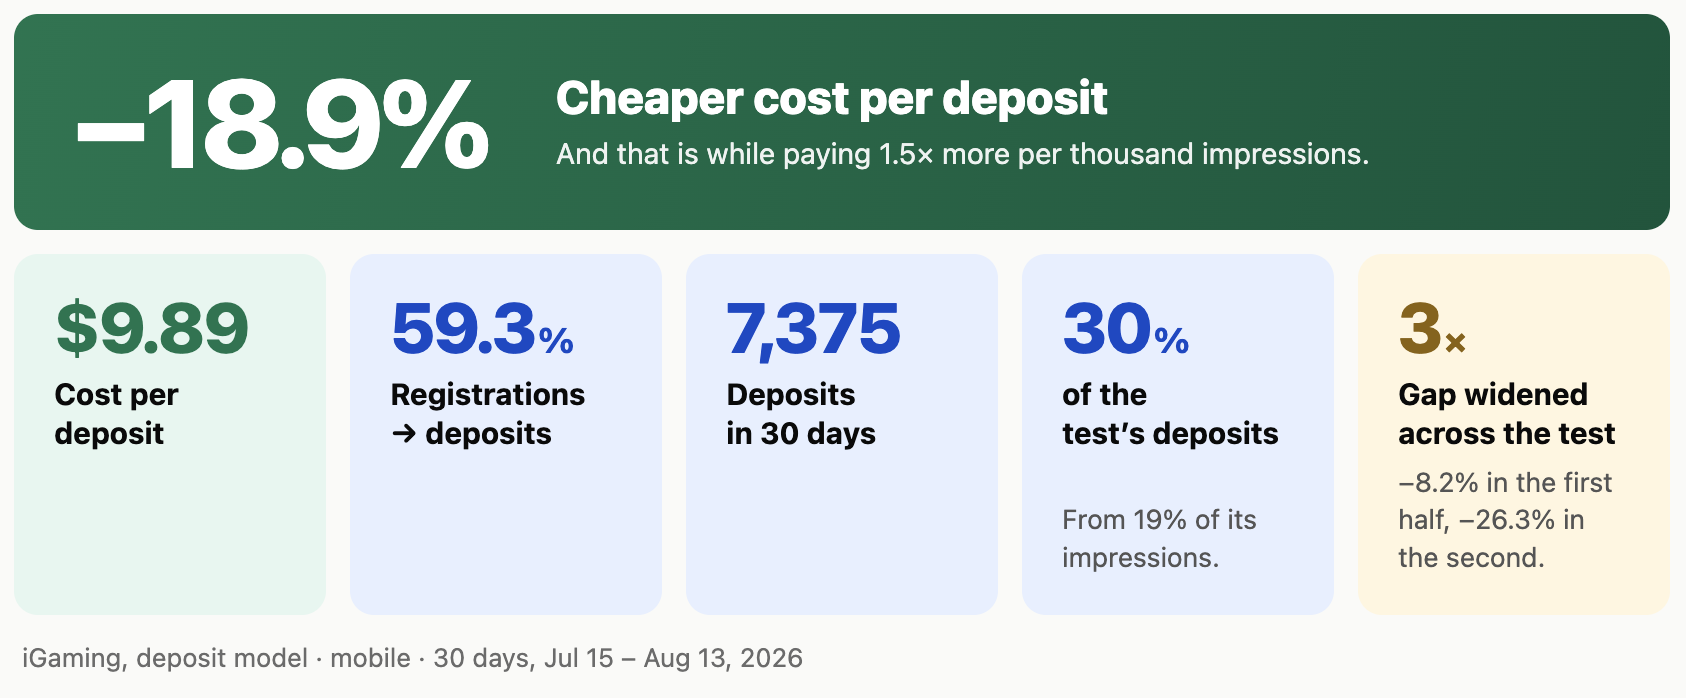
Would you pay 1.5× more per thousand impressions to reduce your cost per deposit by 18.9%? In this 30-day test, Paid Social delivered 7,375 deposits at $9.89 each.
Paid Social traffic can cost more than other formats, but that higher price can pay off further down the funnel. This was our fourth test of Paid Social on an iGaming offer, and once again, its higher CPM resulted in a lower cost per deposit than Popunder.
About the Campaign Setup
The goal was to run a clean A/B test and answer one question:
Does expensive Paid Social traffic actually pay off in a deposit funnel?
To keep the comparison fair, the test followed several rules:
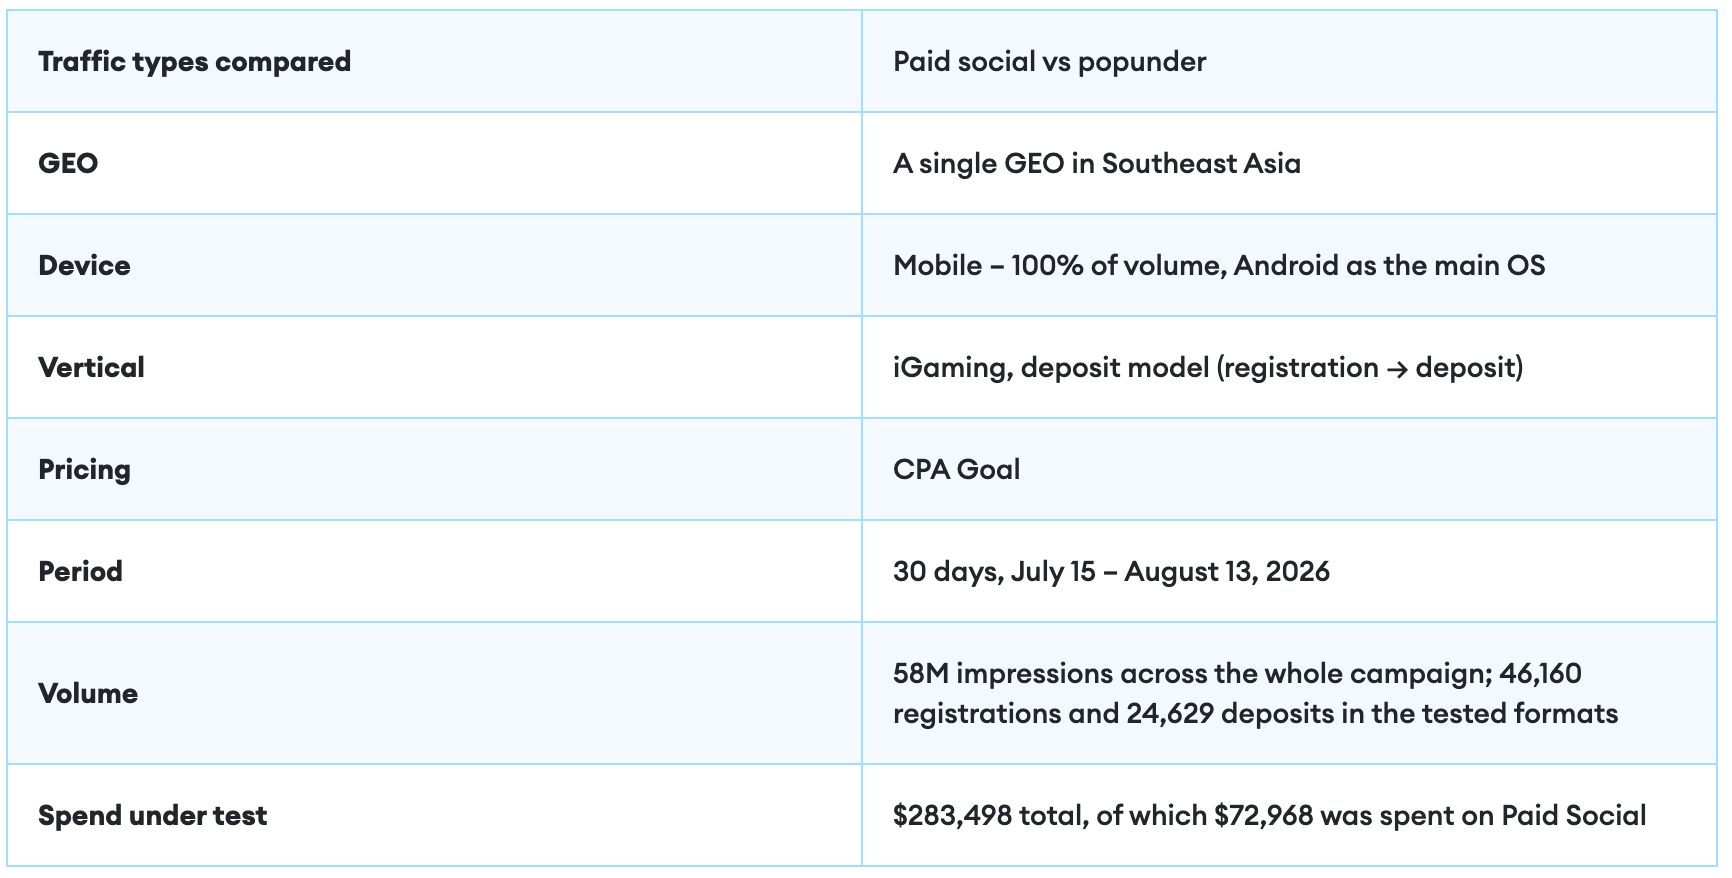
Here are the settings, briefly:

At the registration stage, the results showed no significant difference between the two formats.
Paid Social cost 1.5× more per impression but delivered registrations at almost the same cost. Had our partner stopped the test there, the higher CPM would have been difficult to justify.
The picture changed at the next stage: deposits. Among registered users, 59.3% went on to deposit with Paid Social, compared with 51.2% with Popunder.
Paid Social attracts users who are ready to interact with ads, and that difference becomes more apparent at the deposit stage.
Here are the results:
Consider 100 registrations from each format. Paid Social cost $587 and generated 59 deposits. Popunder cost $624 and generated 51 deposits. The spend was similar, but Paid Social brought in more paying users.
Popunder delivered more deposits overall, but it also received four times the volume. At comparable traffic volumes, Paid Social generated nearly twice as many deposits.
The difference also grew over time. During the first half of the test, Paid Social's cost per deposit was 8.2% lower than Popunder's. In the second half, the gap widened to 26.3%.
This coincided with an increase in the share of registrations that converted into deposits on Paid Social, from 51.7% to 66.1%. Popunder remained nearly flat, moving from 51.0% to 51.3%.
That doesn't mean one traffic source is inherently better than the other, or that you always need to compare them and choose just one. The results show why evaluating traffic by the final conversion can tell a different story from looking at CPM or registrations alone.
Paid Social traffic can cost more than other formats, but that higher price can pay off further down the funnel. This was our fourth test of Paid Social on an iGaming offer, and once again, its higher CPM resulted in a lower cost per deposit than Popunder.
About the Campaign Setup
The goal was to run a clean A/B test and answer one question:
Does expensive Paid Social traffic actually pay off in a deposit funnel?
To keep the comparison fair, the test followed several rules:
- The same offer
- Identical campaign settings, including device and pricing model
- The same testing period
- The same GEO
Here are the settings, briefly:
The Campaign Flow
At the registration stage, the results showed no significant difference between the two formats.At the registration stage, the results showed no significant difference between the two formats.
Paid Social cost 1.5× more per impression but delivered registrations at almost the same cost. Had our partner stopped the test there, the higher CPM would have been difficult to justify.
The picture changed at the next stage: deposits. Among registered users, 59.3% went on to deposit with Paid Social, compared with 51.2% with Popunder.
Paid Social attracts users who are ready to interact with ads, and that difference becomes more apparent at the deposit stage.
Here are the results:
- Paid Social: 7,375 deposits at $9.89 each
- Popunder: 17,254 deposits at $12.20 each
Consider 100 registrations from each format. Paid Social cost $587 and generated 59 deposits. Popunder cost $624 and generated 51 deposits. The spend was similar, but Paid Social brought in more paying users.
Results and the Full Comparison
Over the 30-day test, Paid Social generated 7,375 deposits — 30% of all deposits from the tested formats, despite accounting for just 19% of tested impressions.Popunder delivered more deposits overall, but it also received four times the volume. At comparable traffic volumes, Paid Social generated nearly twice as many deposits.
The difference also grew over time. During the first half of the test, Paid Social's cost per deposit was 8.2% lower than Popunder's. In the second half, the gap widened to 26.3%.
This coincided with an increase in the share of registrations that converted into deposits on Paid Social, from 51.7% to 66.1%. Popunder remained nearly flat, moving from 51.0% to 51.3%.
The Takeaway
Paid Social cost more per impression but generated 1.8× as many deposits per thousand impressions. Under this deposit-based model, the cost per deposit was 18.9% lower than with Popunder.That doesn't mean one traffic source is inherently better than the other, or that you always need to compare them and choose just one. The results show why evaluating traffic by the final conversion can tell a different story from looking at CPM or registrations alone.