


You launch a COD Nutra campaign, CPL looks good, leads start coming in, and then the advertiser reports a weak approval rate.
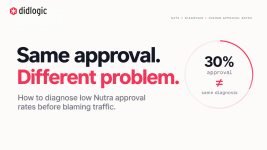
The natural conclusion is: bad traffic. Sometimes that is exactly the problem. But approval rate alone does not tell you enough to make that decision.
Once a lead is submitted, there is another funnel:
A lead can disappear at any of those stages. If the advertiser only sends back one final approval percentage, very different problems can look exactly the same.
For example, these two campaigns both have a 30% approval rate:
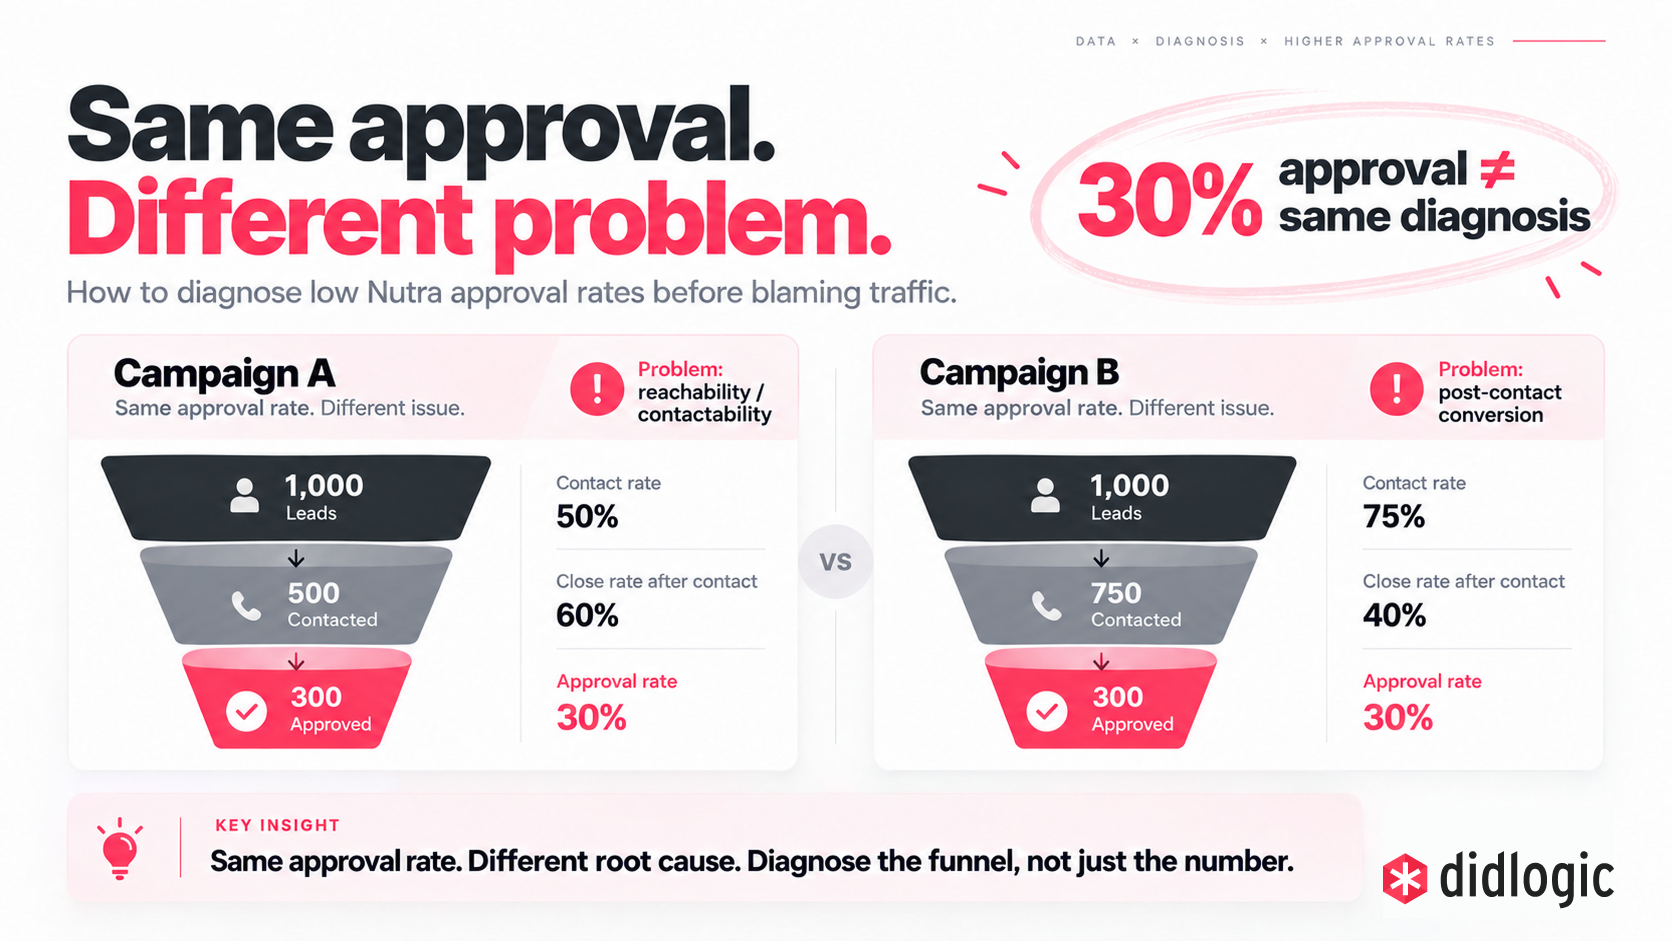
Campaign A converts contacted customers very well. Its problem is getting people on the phone.
Campaign B reaches plenty of people, but fewer of them buy.
Those campaigns should not be optimized the same way. Before cutting a source, I would ask the advertiser or call center for five additional numbers.
How many valid leads were actually contacted?
If approval goes down because fewer customers are answering, changing the creative may do nothing.
A falling contact rate can point toward things like:
This split alone makes approval data much more useful.
Also calculate:
Suppose one source has a 25% overall approval rate but closes 65% of everyone the call center reaches. Another source has a 30% approval rate but closes only 40% of contacted users.
The first source may actually have the better audience. Its weakness is contactability.
That is why a useful SubID report should contain more than leads and approvals:
At 100 leads per day, a call center may contact almost everyone quickly. At 500 leads per day, the same team may start building a queue.
The media buyer sees the same CPL but worse approval and assumes the extra traffic is lower quality.
The actual difference may be that leads are now waiting much longer for the first call.
Instead of asking for one average, split leads into simple buckets:
If performance drops sharply as leads get older, you have found a concrete operational issue worth fixing before changing traffic.
Was the customer called once or four times? Were retries spread throughout the day or made ten minutes apart?
This matters because campaign volume can affect retry behavior. When the call center becomes busy, operators may still make the first attempt but stop performing the second or third attempts that used to recover a meaningful share of orders.
So I would track:
A single status called Rejected hides too much information.
Even a simple breakdown helps:
A spike in invalid numbers is a strong traffic-quality signal.
A spike in unreachable customers suggests investigating contactability.
Customers answering but saying they never expected to buy anything suggests a mismatch between the ad, landing page, and actual offer.
Without reason codes, all three problems become one percentage.
This will not perfectly explain every campaign, but it is far more useful than:
If customers answer the phone and simply do not want the product, voice infrastructure is unlikely to be the main problem.
But if valid leads are difficult to reach, performance changes sharply between GEOs, routes fail, local numbers are unavailable, or call-center volume is growing faster than the existing setup can handle, then the telecom layer is worth checking.
That is the part we work with at didlogic: local numbers, international voice routing, SIP connectivity and messaging across multiple GEOs.
If you have a COD Nutra campaign where lead volume looks healthy but approval does not, share the GEO + contact rate + approval rate below.
Those three numbers are often enough to tell which part of the funnel deserves a closer look.
The natural conclusion is: bad traffic. Sometimes that is exactly the problem. But approval rate alone does not tell you enough to make that decision.
Once a lead is submitted, there is another funnel:
Lead → Contact → Approval → Delivery
A lead can disappear at any of those stages. If the advertiser only sends back one final approval percentage, very different problems can look exactly the same.
For example, these two campaigns both have a 30% approval rate:
Campaign A converts contacted customers very well. Its problem is getting people on the phone.
Campaign B reaches plenty of people, but fewer of them buy.
Those campaigns should not be optimized the same way. Before cutting a source, I would ask the advertiser or call center for five additional numbers.
1. Contact rate
The first question is simple:How many valid leads were actually contacted?
If approval goes down because fewer customers are answering, changing the creative may do nothing.
A falling contact rate can point toward things like:
- Slower first calls
- Overloaded operators
- Poor calling windows
- Invalid or unreachable numbers
- Insufficient retries
- Caller ID or routing issues
This split alone makes approval data much more useful.
2. Close rate among contacted leads
Do not calculate conversion only from total leads.Also calculate:
Approved orders ÷ contacted customers
Suppose one source has a 25% overall approval rate but closes 65% of everyone the call center reaches. Another source has a 30% approval rate but closes only 40% of contacted users.
The first source may actually have the better audience. Its weakness is contactability.
That is why a useful SubID report should contain more than leads and approvals:
- Leads
- Contacted
- Contact %
- Approved
- Close % among contacted
3. Time to first call
This becomes especially important when campaigns scale.At 100 leads per day, a call center may contact almost everyone quickly. At 500 leads per day, the same team may start building a queue.
The media buyer sees the same CPL but worse approval and assumes the extra traffic is lower quality.
The actual difference may be that leads are now waiting much longer for the first call.
Instead of asking for one average, split leads into simple buckets:
- Under 5 minutes
- 5–15 minutes
- 15–30 minutes
- 30–60 minutes
- 1 hour+
If performance drops sharply as leads get older, you have found a concrete operational issue worth fixing before changing traffic.
4. Number of call attempts
“Unreachable” is not very useful unless you know what happened before the lead received that status.Was the customer called once or four times? Were retries spread throughout the day or made ten minutes apart?
This matters because campaign volume can affect retry behavior. When the call center becomes busy, operators may still make the first attempt but stop performing the second or third attempts that used to recover a meaningful share of orders.
So I would track:
- Average attempts per lead
- Contact rate by attempt number
- Approvals generated after attempt 2+
5. Rejection reasons
Finally, ask why leads are being rejected.A single status called Rejected hides too much information.
Even a simple breakdown helps:
- Invalid phone
- Unreachable
- Duplicate
- Customer denies submitting
- Not interested
- Price objection
- Cancelled
- Language issue
A spike in invalid numbers is a strong traffic-quality signal.
A spike in unreachable customers suggests investigating contactability.
Customers answering but saying they never expected to buy anything suggests a mismatch between the ad, landing page, and actual offer.
Without reason codes, all three problems become one percentage.
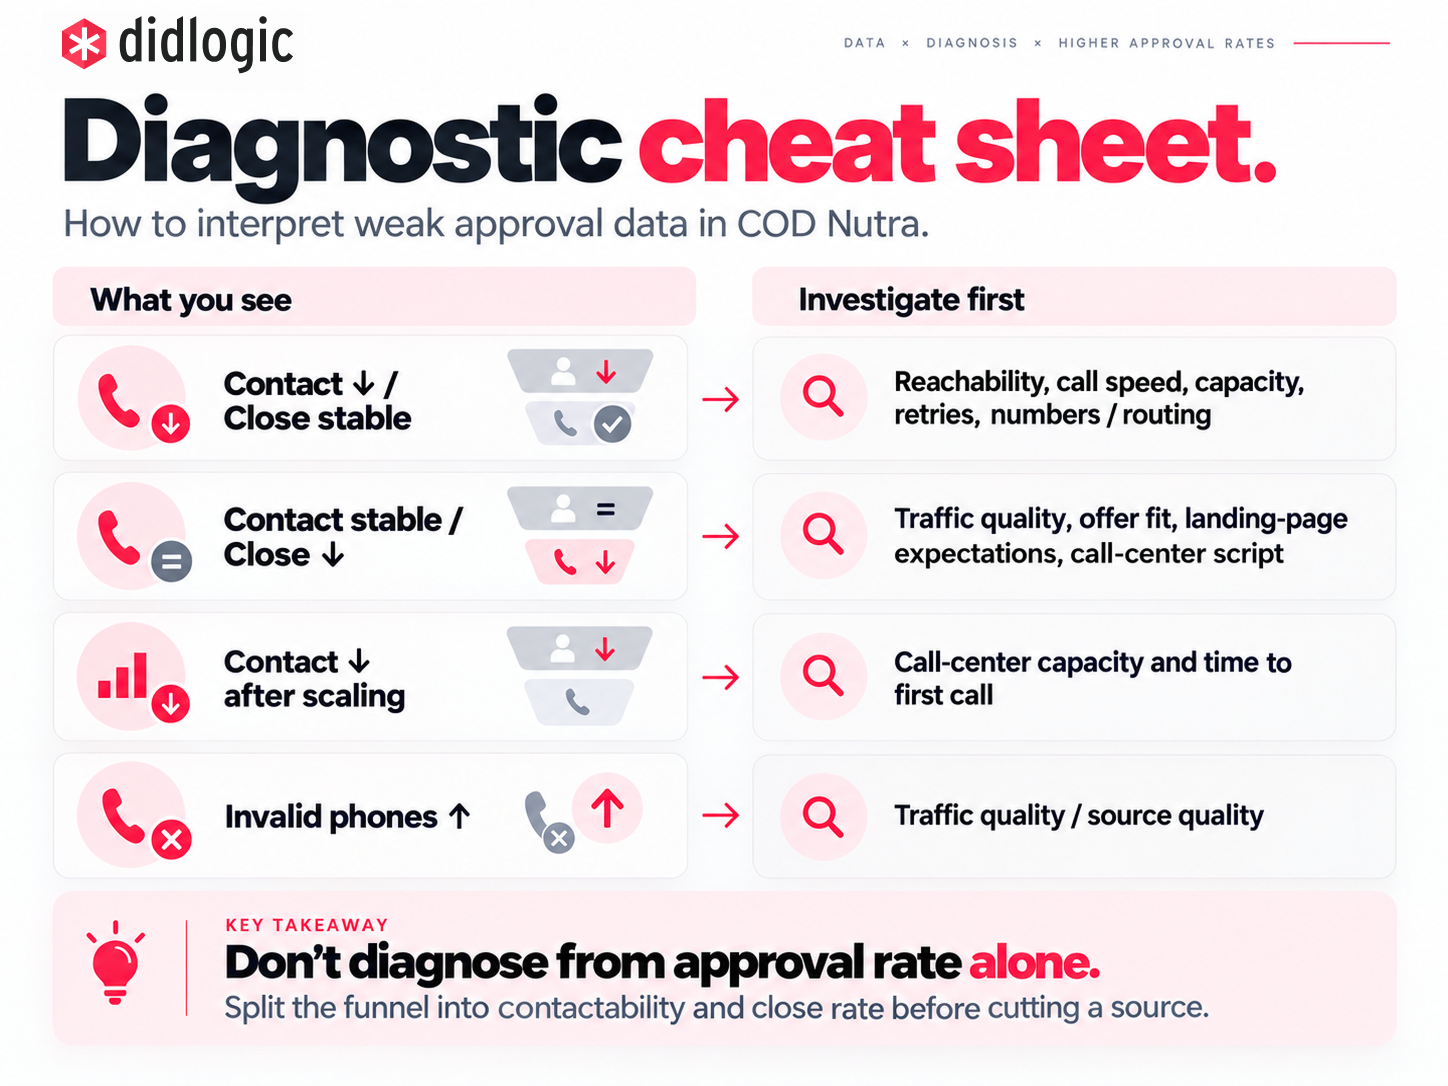
A simple diagnostic
I would read the numbers roughly like this:This will not perfectly explain every campaign, but it is far more useful than:
Approval dropped → kill the source.
Where telecom becomes relevant
Telecom is obviously not the explanation for every weak Nutra campaign.If customers answer the phone and simply do not want the product, voice infrastructure is unlikely to be the main problem.
But if valid leads are difficult to reach, performance changes sharply between GEOs, routes fail, local numbers are unavailable, or call-center volume is growing faster than the existing setup can handle, then the telecom layer is worth checking.
That is the part we work with at didlogic: local numbers, international voice routing, SIP connectivity and messaging across multiple GEOs.
If you have a COD Nutra campaign where lead volume looks healthy but approval does not, share the GEO + contact rate + approval rate below.
Those three numbers are often enough to tell which part of the funnel deserves a closer look.