



If you've run affiliate marketing campaigns for a while, you know the drill very well. You pick a GEO, set a bid, upload a creative, and monitor metrics to optimize data-based. The feedback loop is fast enough that you can course-correct within a day. But when you move the budget into video, you feel like a newbie again. It brings a new terminology, four completely different supply sources, and pricing logic that doesn't map cleanly onto anything you already know from push/pop buying.
RichAds — is a trusted ad network for agencies and brands built around scaling registrations, deposits, and KPI targets like reach and traffic — just closed that knowledge gap with a comprehensive research report. It's authored by Alexandra Lamish, RichAds' Chief Marketing Officer, who has spent over 16 years across adtech, e-commerce, hospitality, and FMCG marketing before landing at RichAds.
Her framing for why the report exists is blunt:
"Nobody needs convincing anymore that video works. What's changed is how measurable it's become: proper postback, source-level bidding, CPA Goal optimization — video is no longer a black box between impression and deposit. It's still a reach-and-awareness tool first, not a direct-response one, but the tracking underneath it keeps getting sharper every quarter. And AI has completely changed the game on the creative side, letting teams turn performance data into fast, large-scale creative production instead of guessing what to make next."
— Alexandra Lamish
What follows is a rundown of the report's core findings, framed for anyone running or considering video traffic in gambling and betting. Plus, you’ll see a real campaign breakdown the RichAds team used to stress-test their own conclusions.
The report separates them cleanly:
The report walks through all eight mentioned format types — In-Stream, Out-Stream, Pre-Roll, Mid-Roll, Post-Roll, Rewarded, Interstitial, and Native — and evaluates each specifically against gambling and betting use cases. It clearly outlines the pros and cons of each format, so you can make an informed choice.
1. Mainstream video networks — video hosting platforms, streaming sites, news portals with embedded video. They are clean, whitelisted, safe for compliant brands, but pricey.
2. Non-Mainstream video networks — torrent sites, file-sharing platforms, pirated streaming apps. They offer minimal moderation and low CPMs and accept grey-and-black-hat gambling creatives that would never clear Mainstream review.
3. Social Video — TikTok, YouTube Shorts, Meta feeds. They deliver enormous reach and precision targeting, but gambling and betting content faces the strictest policy enforcement here. Account bans are also a constant operational risk.
4. CTV/OTT — Netflix, Roku, connected TVs and smart TV apps. These platforms ensure near-100% completion rates and premium brand perception, but budgets start high and moderation is strict. This channel is essentially closed to direct-response gambling creo and only realistic for licensed brand campaigns.
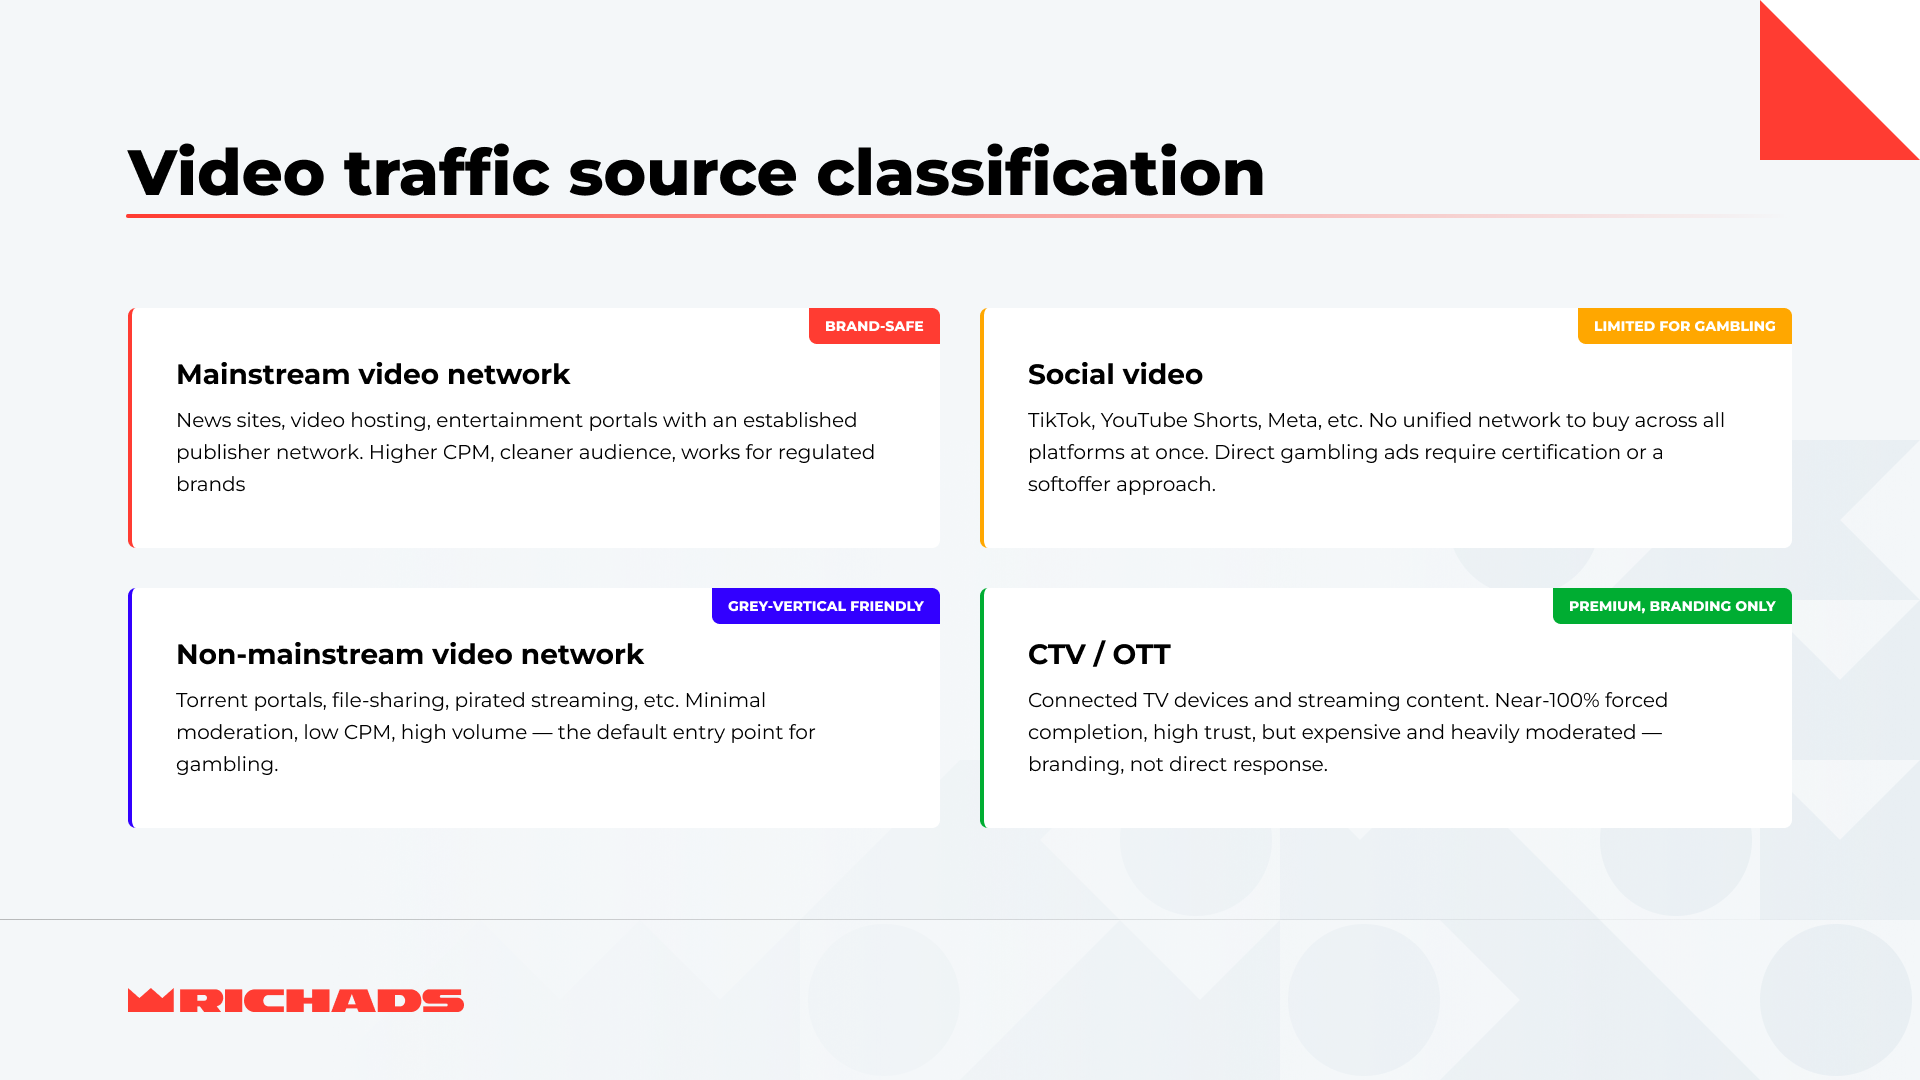
Most affiliates think "video" means Social Video by default, because that's the only channel with a familiar self-serve interface. The report introduces more effective video traffic sources. It shows that Non-Mainstream and Mainstream video networks are where most of the actual gambling and betting volume lives. That’s where RichAds itself operates, so they also provide their inside data as proof.
The research covers four main aspects: impression number, time spent, invalid traffic volume, and ad spend for each channel. The data shows that:
CTV time-spent growth has roughly halved. It grew 15% in 2025 versus 2024, but the 2026 projection sits at just 8.4%. It’s a clear signal that the CTV/OTT market has moved from a land-grab phase into something closer to mature, incremental growth.
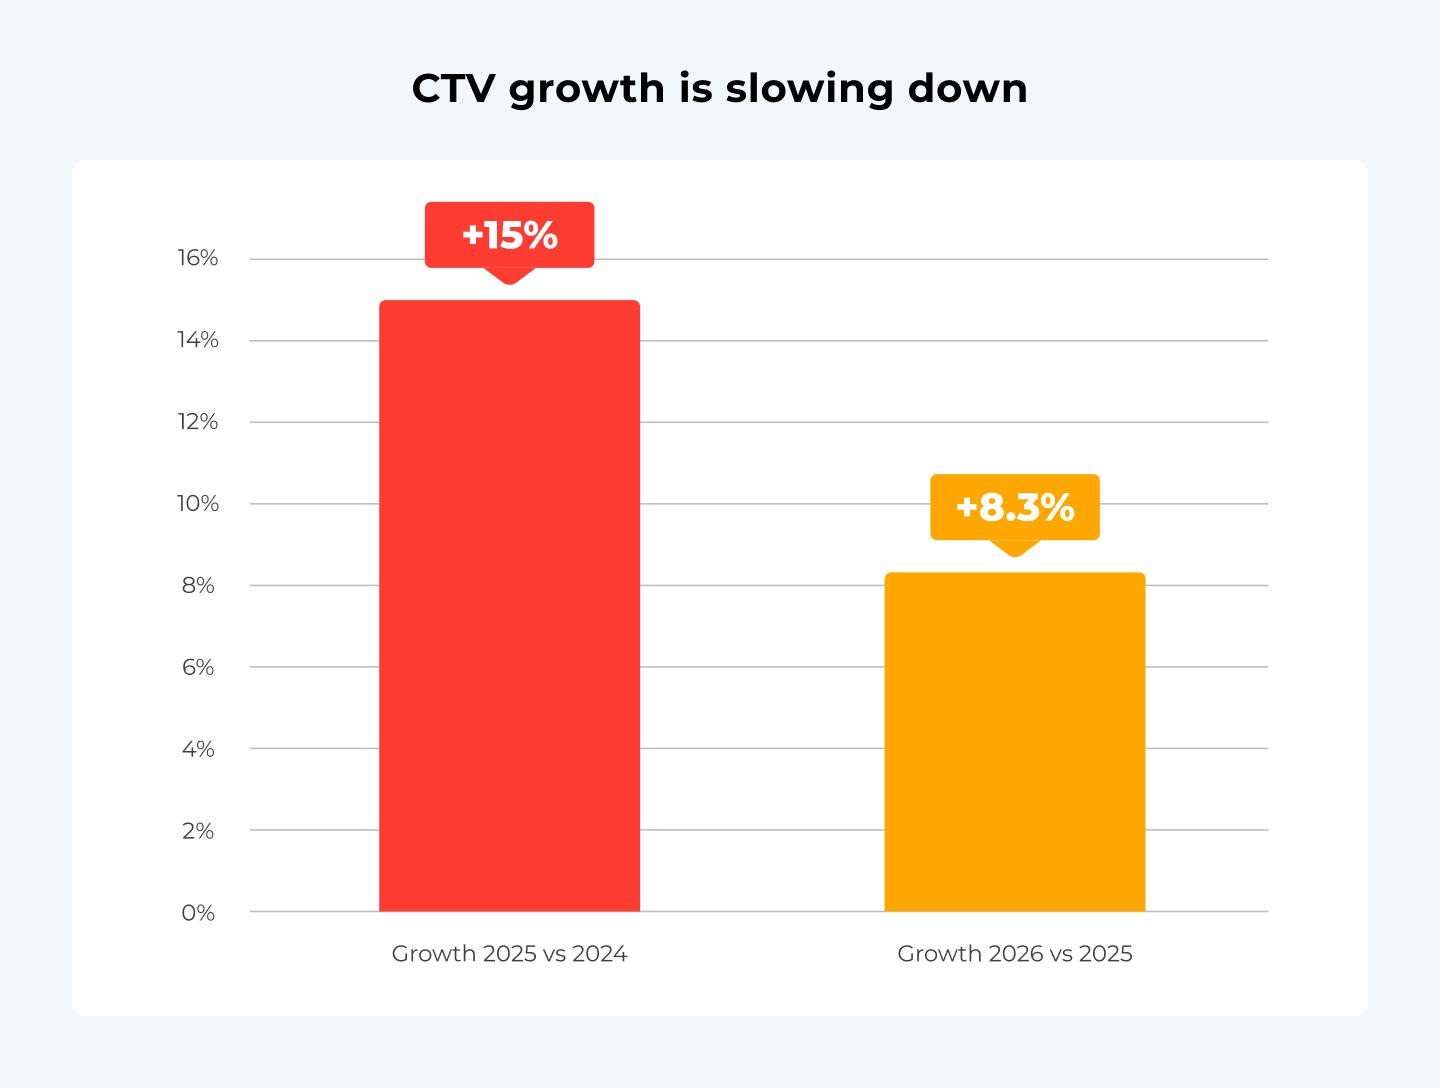
CTV growth is slowing down
Invalid traffic on mobile has climbed steadily and shows no sign of plateauing. Pixalate's quarterly benchmarks show mobile app IVT rising from 29% in Q2 2025 to 41% by Q2 2026 — a straight, uninterrupted climb, while both web and CTV fraud rates grew far more slowly over the same window. Put those two data points side by side and you get an uncomfortable picture: the channel growing fastest by budget (mobile) is also the one where fraud is compounding fastest.
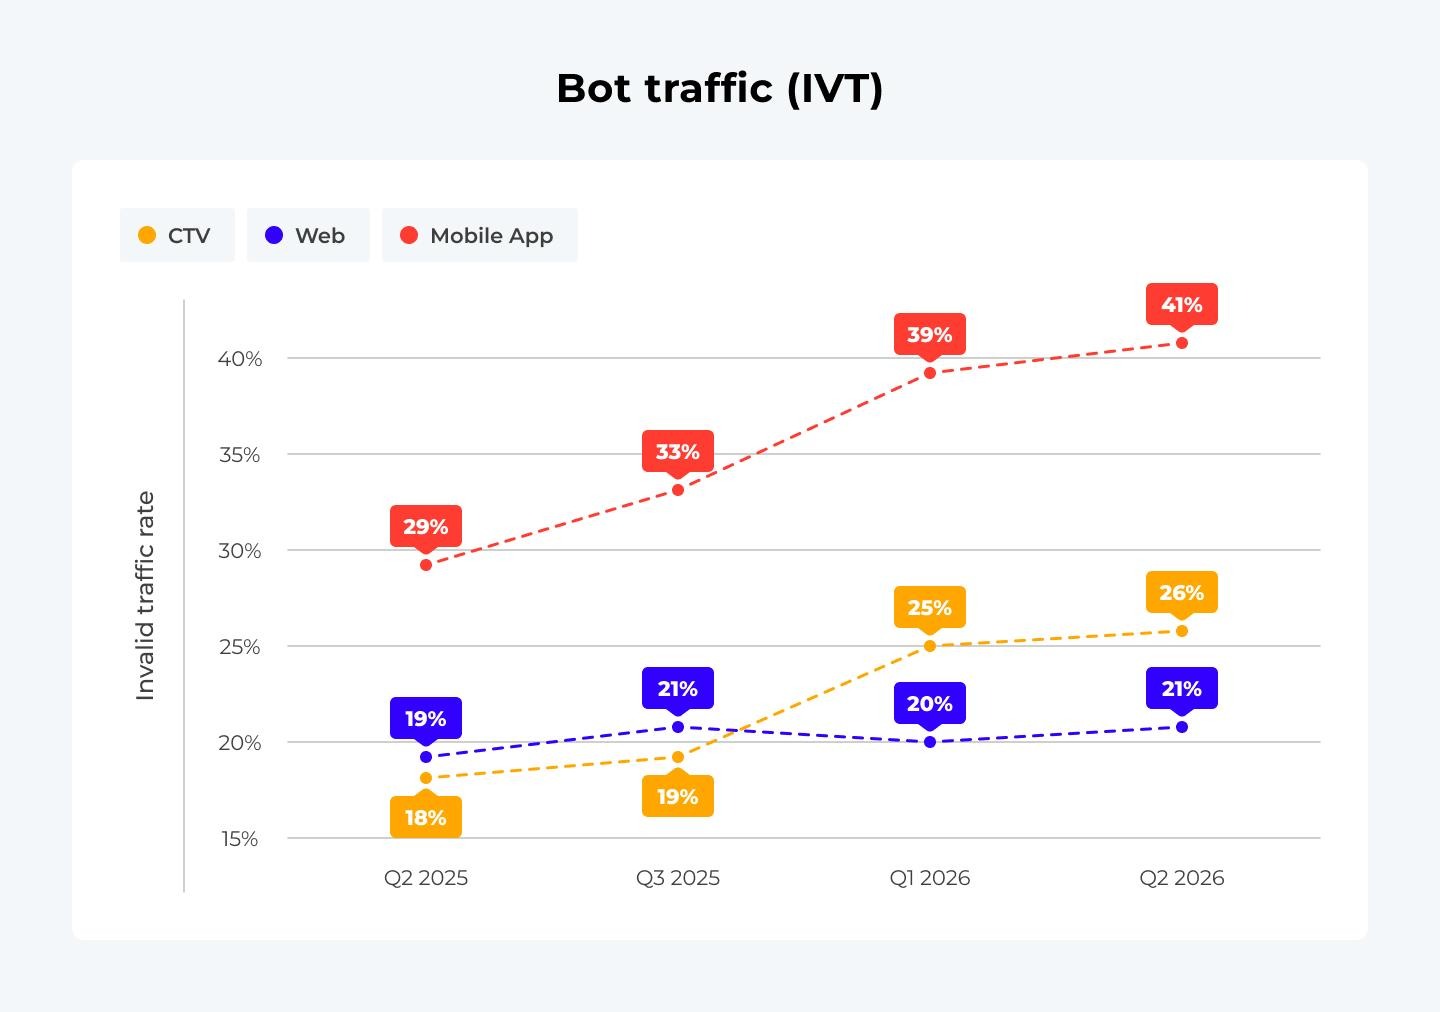
Bot traffic (IVT)
Social video audience growth is real but wildly uneven in reliability. YouTube's numbers move in a tight, predictable 6–7% year-over-year band, which makes sense, since third-party estimators (DataReportal, Statista, Backlinko) tend to converge. Meta is slowing from +6.8% to +4% growth over three years, but at least its DAU figures are officially disclosed via SEC filings, so the trend itself can be trusted even if the MAU extrapolation is imperfect. TikTok is the outlier that breaks the whole exercise because ByteDance discloses nothing officially. The third-party 2026 estimates range from 1.00B to 2.20B users — a spread of over a billion. That's not a growth trend; it's noise dressed up as data.
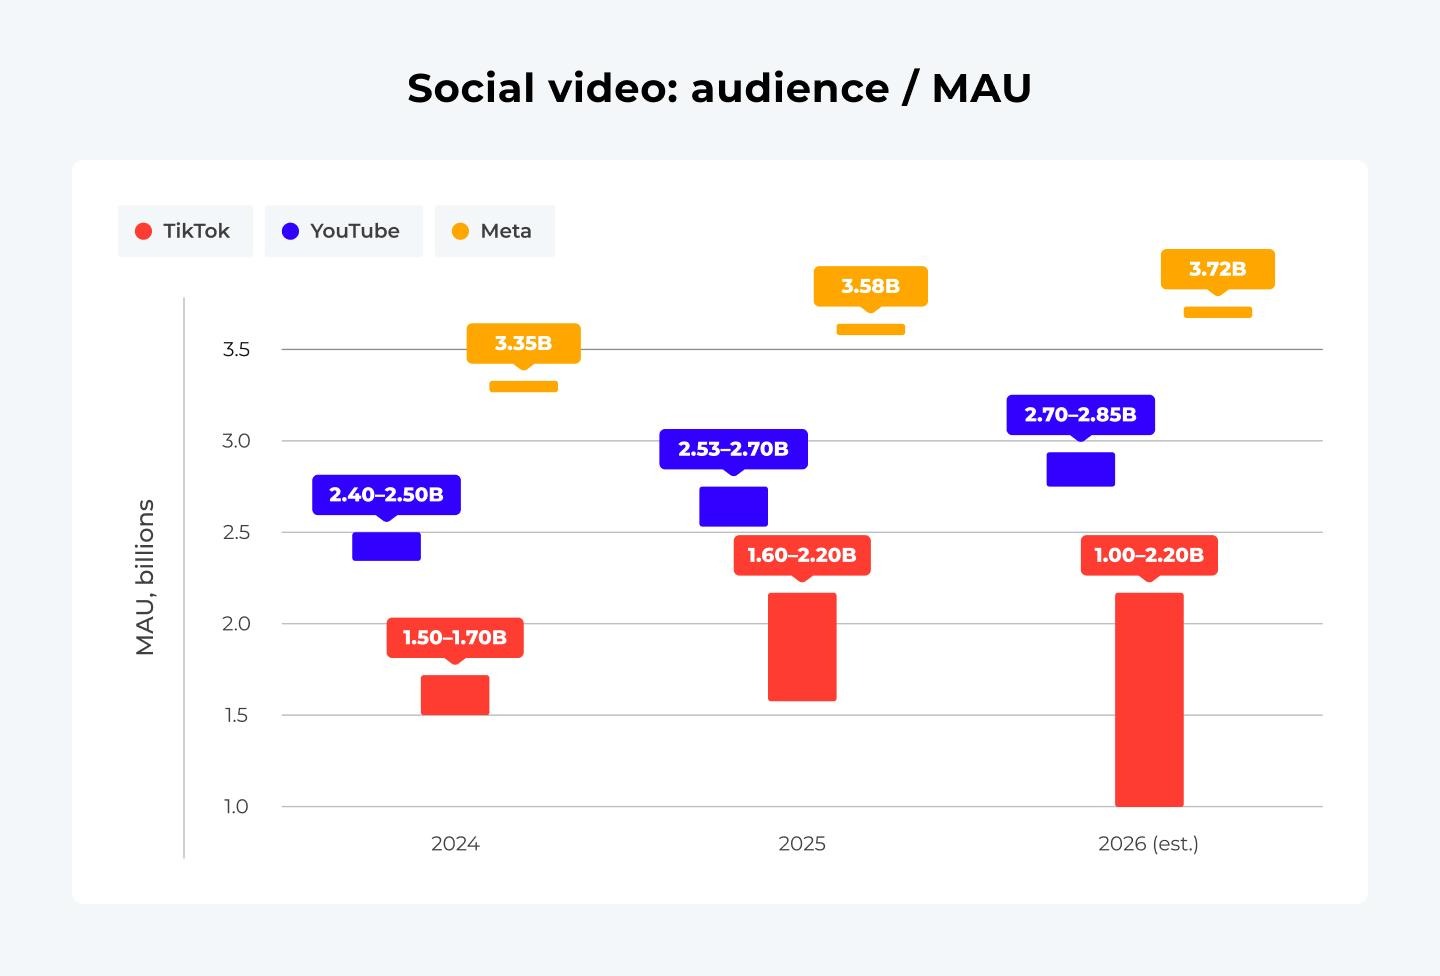
Social video: audience / MAU
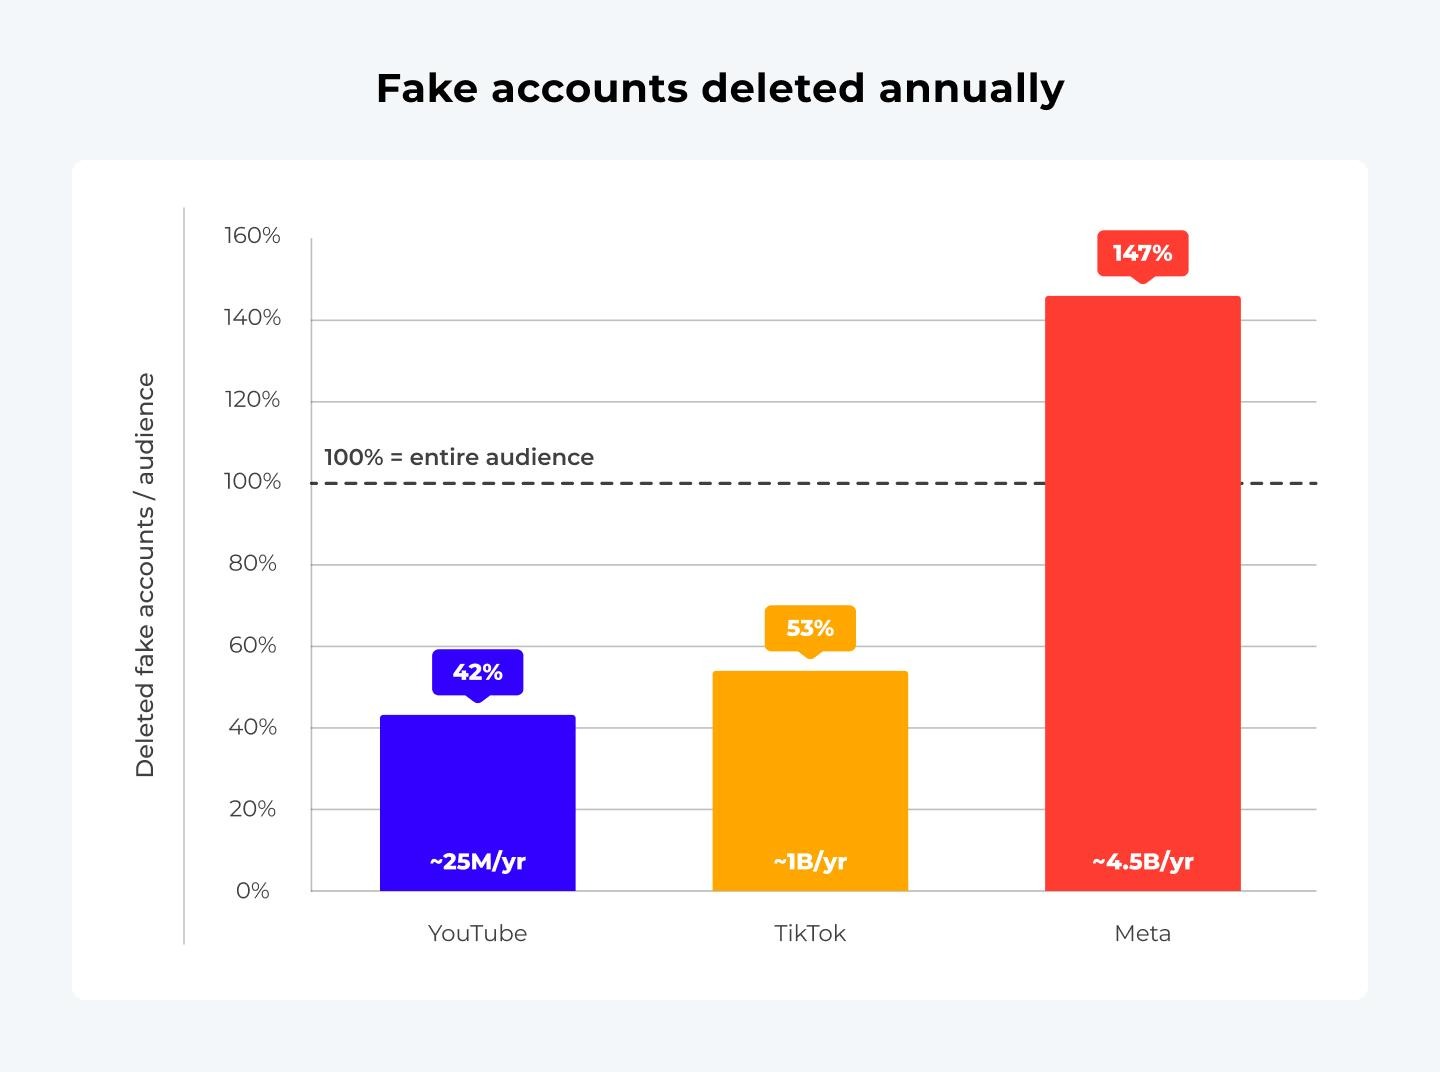
The fake-account problem is bigger than most buyers realize. Meta reportedly removes roughly 4.5 billion fake accounts annually, which is 147% of its own publicly reported audience size. The platform is fighting a bot volume larger than its entire real user base every single year. TikTok removes around 1 billion (53% of its audience), and YouTube around 25 million spam channels (42% of its base). For anyone buying "engagement" on social video without a fraud filter, these numbers should reframe what a raw view count actually represents.
Fake accounts deleted annually
The report also provides many other important video statistics figures that you will probably want to revisit when selecting video traffic sources and launching campaigns.
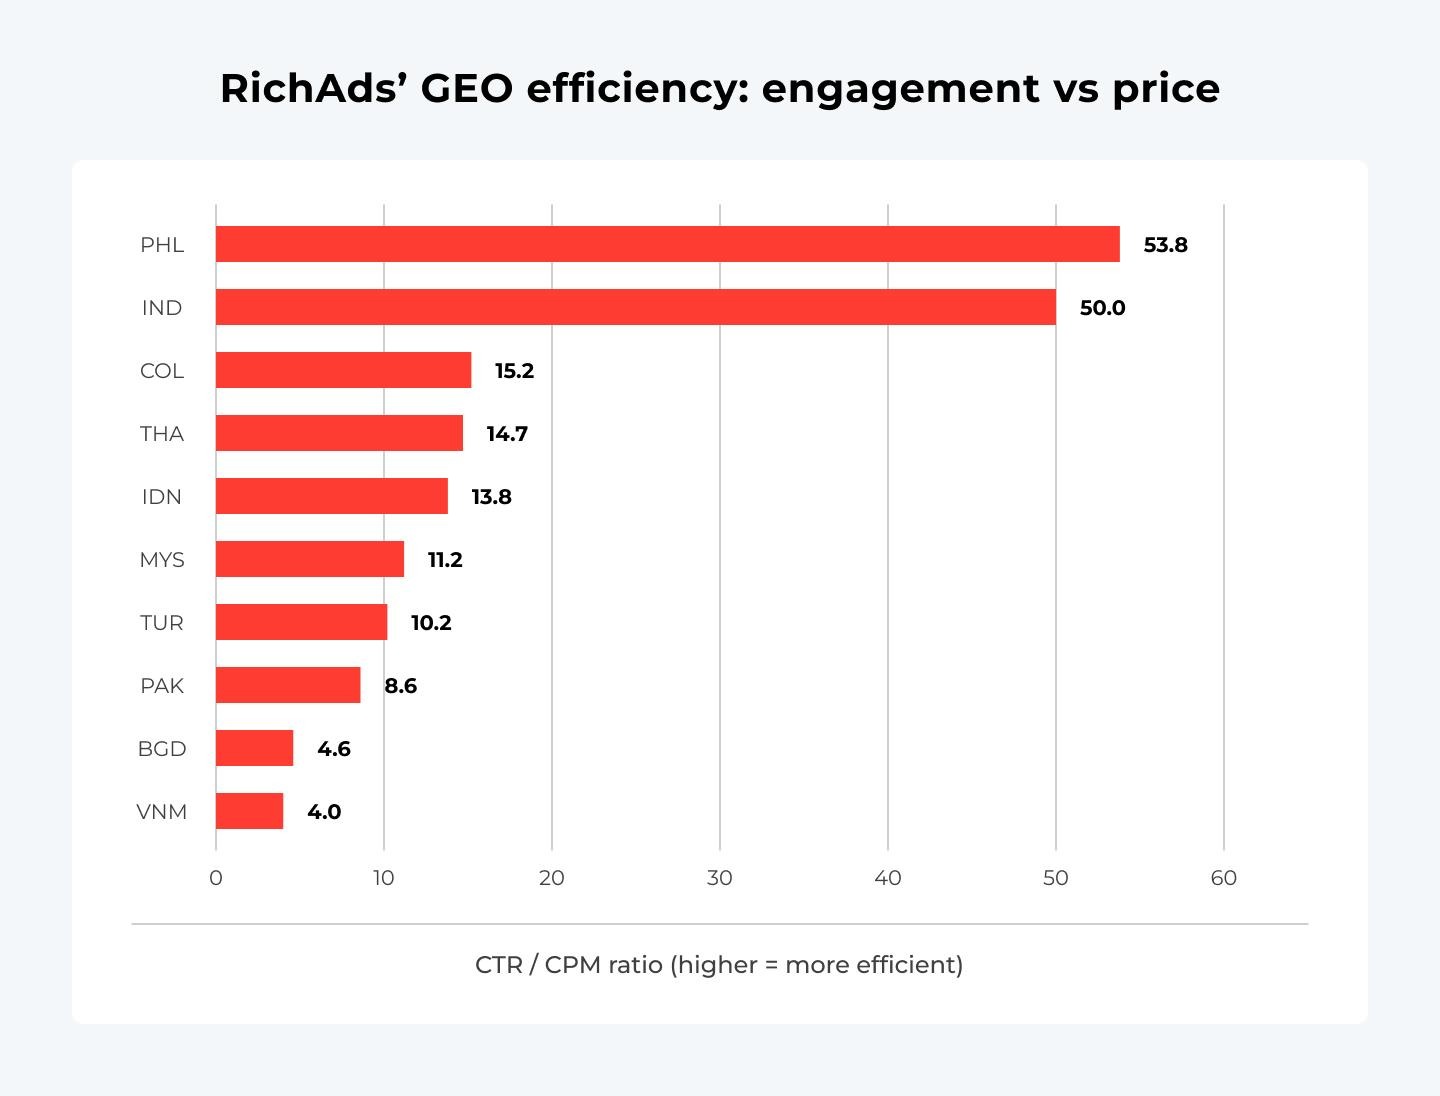
The Philippines comes out on top by a wide margin, followed by India, Colombia, Thailand, and Indonesia. The logic is simple but easy to miss when you're just eyeballing a CPM table: a market with strong CTR and a still-low CPM means advertiser demand hasn't fully priced in the traffic quality, which is exactly the window where testing budget goes furthest before the market corrects.
RichAds' GEO efficiency: engagement vs price
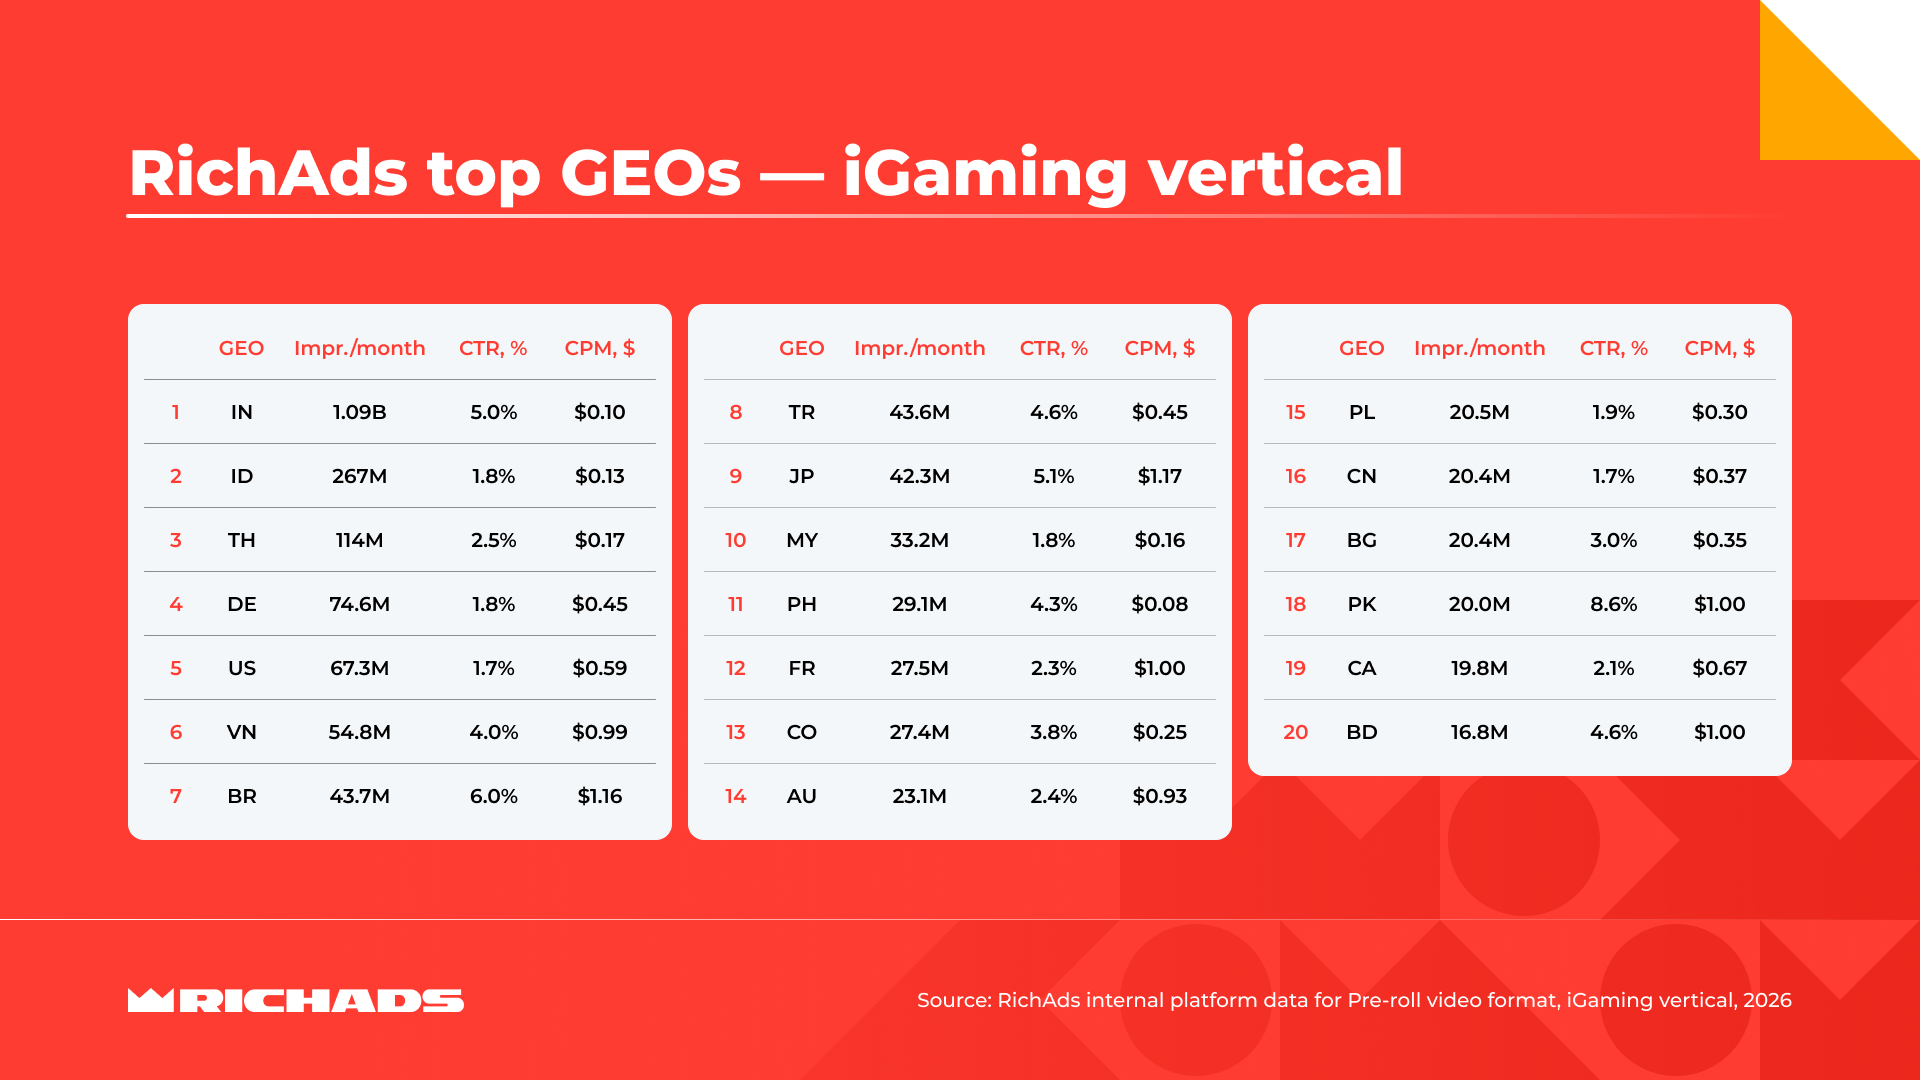
India specifically gets called out for this reason — it delivers over a billion monthly impressions at rock-bottom CPM with a solid CTR, making it the obvious pick for fast, cheap creative and lander testing at volume.
The report is careful to flag the catch, though: cheap Tier-3 volume in gambling often breaks down specifically at the deposit stage, so that India volume should be treated as a testing ground, not assumed as a core ROI source, until the funnel is validated all the way to first-time deposit.
Ultimately, there is a list of 20 countries, so you can pick the best ones for any offer and video campaign goal.
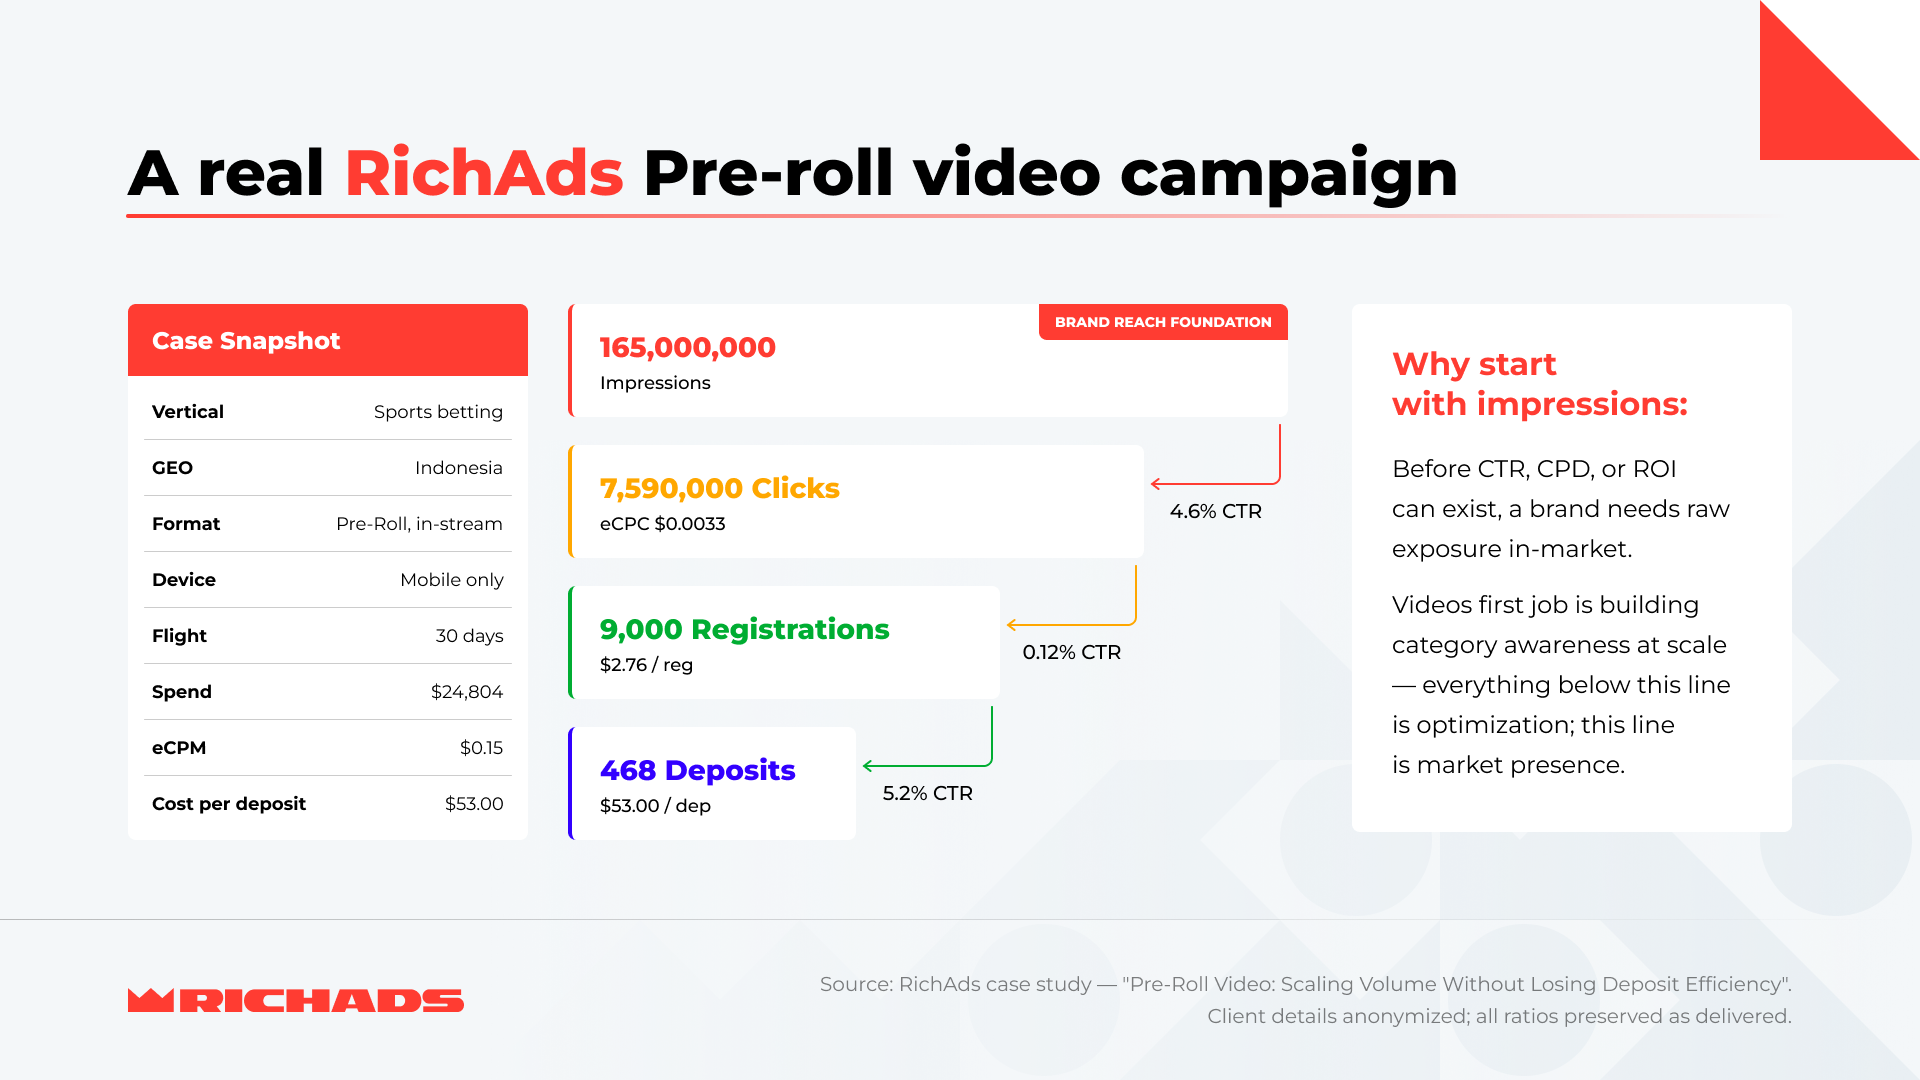
The client's brief was simple to state and genuinely hard to deliver on: scale reach aggressively while holding cost per deposit predictable and low — the exact tension between volume and quality that trips up most video campaigns.
Over a 30-day flight, running mobile-only skippable in-stream pre-roll at $24,804 total spend, the campaign delivered:
A real RichAds Pre-roll video campaign — case snapshot
The report frames the result as proof that pre-roll can absorb aggressive scaling without sacrificing deposit quality, even in a genuinely competitive vertical like sports betting.
This case also reinforces the report's central positioning of video as a top-of-funnel format. The impressions build category awareness first, and everything measured downstream of that (CTR, cost per deposit, ROI) is optimization layered on top of the reach foundation, not a substitute for it.
For anyone buying gambling or betting traffic, the practical takeaway is that channel choice should follow the specific job at hand: Non-Mainstream networks for cheap, fast testing; Mainstream networks for cleaner, higher-trust audiences; CTV only if you're running licensed brand campaigns with the budget to match.
RichAds positions its own pre-roll inventory squarely in that Mainstream lane. It delivers whitelisted publisher access with anti-fraud filtering layered in, plus S2S postback, Smart Retargeting, and Target CPA tools built specifically to close the measurement gap between impression and deposit that eats most buyers' budgets.
The full research report, including the complete 20-GEO table, format-by-format pricing benchmarks, and a breakdown of 2026 creative trends is live on the RichAds blog now. Check it out to understand video just as well as you know push and pop formats.
RichAds — is a trusted ad network for agencies and brands built around scaling registrations, deposits, and KPI targets like reach and traffic — just closed that knowledge gap with a comprehensive research report. It's authored by Alexandra Lamish, RichAds' Chief Marketing Officer, who has spent over 16 years across adtech, e-commerce, hospitality, and FMCG marketing before landing at RichAds.
Her framing for why the report exists is blunt:
"Nobody needs convincing anymore that video works. What's changed is how measurable it's become: proper postback, source-level bidding, CPA Goal optimization — video is no longer a black box between impression and deposit. It's still a reach-and-awareness tool first, not a direct-response one, but the tracking underneath it keeps getting sharper every quarter. And AI has completely changed the game on the creative side, letting teams turn performance data into fast, large-scale creative production instead of guessing what to make next."
— Alexandra Lamish
What follows is a rundown of the report's core findings, framed for anyone running or considering video traffic in gambling and betting. Plus, you’ll see a real campaign breakdown the RichAds team used to stress-test their own conclusions.
The Terminology Problem: Eight Formats, Three Classification Systems
Most of the confusion around video buying comes from the fact that "video format" isn't one axis — it's three, stacked on top of each other, and most guides mash them together without saying so.The report separates them cleanly:
- By placement — in-stream (the ad lives inside an existing video player) and out-stream (the ad shows up inside an article, a social feed, or a banner slot that has nothing to do with video content).
- By timing within the viewing session — pre-roll (before the content), mid-roll (during a break), or post-roll (after the content ends).
- By how the user is expected to engage — rewarded video (users opt in for an in-app reward), interstitial video (a full-screen takeover), or native video (blended visually into the surrounding feed).
The report walks through all eight mentioned format types — In-Stream, Out-Stream, Pre-Roll, Mid-Roll, Post-Roll, Rewarded, Interstitial, and Native — and evaluates each specifically against gambling and betting use cases. It clearly outlines the pros and cons of each format, so you can make an informed choice.
The Four Video Traffic Sources to Know
This is arguably the most useful section for anyone coming from push or pop. Lamish breaks video inventory into four distinct buying channels, each with its own economics and moderation reality:1. Mainstream video networks — video hosting platforms, streaming sites, news portals with embedded video. They are clean, whitelisted, safe for compliant brands, but pricey.
2. Non-Mainstream video networks — torrent sites, file-sharing platforms, pirated streaming apps. They offer minimal moderation and low CPMs and accept grey-and-black-hat gambling creatives that would never clear Mainstream review.
3. Social Video — TikTok, YouTube Shorts, Meta feeds. They deliver enormous reach and precision targeting, but gambling and betting content faces the strictest policy enforcement here. Account bans are also a constant operational risk.
4. CTV/OTT — Netflix, Roku, connected TVs and smart TV apps. These platforms ensure near-100% completion rates and premium brand perception, but budgets start high and moderation is strict. This channel is essentially closed to direct-response gambling creo and only realistic for licensed brand campaigns.
Most affiliates think "video" means Social Video by default, because that's the only channel with a familiar self-serve interface. The report introduces more effective video traffic sources. It shows that Non-Mainstream and Mainstream video networks are where most of the actual gambling and betting volume lives. That’s where RichAds itself operates, so they also provide their inside data as proof.
The Statistics: How Video Traffic Performs in 2026
Here's where the report earns its "research" label rather than just being a marketing piece. Lamish cross-references Pixalate, eMarketer, and Nielsen data against RichAds' own platform numbers, so you can make your own conclusions on video ads performance.The research covers four main aspects: impression number, time spent, invalid traffic volume, and ad spend for each channel. The data shows that:
CTV time-spent growth has roughly halved. It grew 15% in 2025 versus 2024, but the 2026 projection sits at just 8.4%. It’s a clear signal that the CTV/OTT market has moved from a land-grab phase into something closer to mature, incremental growth.
CTV growth is slowing down
Invalid traffic on mobile has climbed steadily and shows no sign of plateauing. Pixalate's quarterly benchmarks show mobile app IVT rising from 29% in Q2 2025 to 41% by Q2 2026 — a straight, uninterrupted climb, while both web and CTV fraud rates grew far more slowly over the same window. Put those two data points side by side and you get an uncomfortable picture: the channel growing fastest by budget (mobile) is also the one where fraud is compounding fastest.
Bot traffic (IVT)
Social video audience growth is real but wildly uneven in reliability. YouTube's numbers move in a tight, predictable 6–7% year-over-year band, which makes sense, since third-party estimators (DataReportal, Statista, Backlinko) tend to converge. Meta is slowing from +6.8% to +4% growth over three years, but at least its DAU figures are officially disclosed via SEC filings, so the trend itself can be trusted even if the MAU extrapolation is imperfect. TikTok is the outlier that breaks the whole exercise because ByteDance discloses nothing officially. The third-party 2026 estimates range from 1.00B to 2.20B users — a spread of over a billion. That's not a growth trend; it's noise dressed up as data.
Social video: audience / MAU
The fake-account problem is bigger than most buyers realize. Meta reportedly removes roughly 4.5 billion fake accounts annually, which is 147% of its own publicly reported audience size. The platform is fighting a bot volume larger than its entire real user base every single year. TikTok removes around 1 billion (53% of its audience), and YouTube around 25 million spam channels (42% of its base). For anyone buying "engagement" on social video without a fraud filter, these numbers should reframe what a raw view count actually represents.
Fake accounts deleted annually
The report also provides many other important video statistics figures that you will probably want to revisit when selecting video traffic sources and launching campaigns.
GEO Efficiency: Where the Report Gets Genuinely Actionable
Virtually every network today provides a list of top geos by traffic volume, and we would have skipped this part of the report were it not for a unique approach. Alexandra Lamish calculates a CTR-to-CPM efficiency ratio across RichAds' own iGaming video data, essentially flagging which markets have engagement that competition hasn't caught up to yet.The Philippines comes out on top by a wide margin, followed by India, Colombia, Thailand, and Indonesia. The logic is simple but easy to miss when you're just eyeballing a CPM table: a market with strong CTR and a still-low CPM means advertiser demand hasn't fully priced in the traffic quality, which is exactly the window where testing budget goes furthest before the market corrects.
RichAds' GEO efficiency: engagement vs price
India specifically gets called out for this reason — it delivers over a billion monthly impressions at rock-bottom CPM with a solid CTR, making it the obvious pick for fast, cheap creative and lander testing at volume.
The report is careful to flag the catch, though: cheap Tier-3 volume in gambling often breaks down specifically at the deposit stage, so that India volume should be treated as a testing ground, not assumed as a core ROI source, until the funnel is validated all the way to first-time deposit.
Ultimately, there is a list of 20 countries, so you can pick the best ones for any offer and video campaign goal.
The Indonesia Case Study: Turning the Theory Into a Real Campaign
The research isn’t purely theoretical, RichAds ran an actual pre-roll video campaign for a sports betting brand in Indonesia specifically to pressure-test the ideas in the report.The client's brief was simple to state and genuinely hard to deliver on: scale reach aggressively while holding cost per deposit predictable and low — the exact tension between volume and quality that trips up most video campaigns.
Over a 30-day flight, running mobile-only skippable in-stream pre-roll at $24,804 total spend, the campaign delivered:
- 165,000,000+ impressions
- 7,590,000 clicks at a 4.6% CTR and a $0.0033 eCPC
- 9,000 registrations at $2.76 per registration
- 468 deposits at a $53.00 cost per deposit — roughly a 5.2% registration-to-deposit conversion rate
A real RichAds Pre-roll video campaign — case snapshot
The report frames the result as proof that pre-roll can absorb aggressive scaling without sacrificing deposit quality, even in a genuinely competitive vertical like sports betting.
This case also reinforces the report's central positioning of video as a top-of-funnel format. The impressions build category awareness first, and everything measured downstream of that (CTR, cost per deposit, ROI) is optimization layered on top of the reach foundation, not a substitute for it.
Who Actually Benefits From Running Video Right Now
The report closes with a segmentation that's worth reading closely if you're deciding whether video belongs in your format stack at all. In short, it names four groups that should consider video advertising:- Operators pushing into new Tier-2/Tier-3 markets, where the goal is fast, cheap reach before local competition and pricing catch up.
- Media buyers running high-volume creative and hypothesis testing, using cheap, high-impression GEOs like India to iterate through variations quickly.
- Established brands already buying Tier-1 traffic, for whom lead quality outweighs raw CTR as the metric that matters.
- Buyers who want hands-on platform support, from campaign setup through creative production, rather than a pure self-serve dashboard.
The Bottom Line
The report stands out for its wealth of insight information, abundance of statistics figures and real-world data, and accessible presentation of facts. It doesn’t just say "video is growing", it explains why and where this growth is actually seen. Because video advertising in 2026 is four structurally different markets stitched under one label, each with its own growth curve, fraud profile, and moderation ceiling.For anyone buying gambling or betting traffic, the practical takeaway is that channel choice should follow the specific job at hand: Non-Mainstream networks for cheap, fast testing; Mainstream networks for cleaner, higher-trust audiences; CTV only if you're running licensed brand campaigns with the budget to match.
RichAds positions its own pre-roll inventory squarely in that Mainstream lane. It delivers whitelisted publisher access with anti-fraud filtering layered in, plus S2S postback, Smart Retargeting, and Target CPA tools built specifically to close the measurement gap between impression and deposit that eats most buyers' budgets.
The full research report, including the complete 20-GEO table, format-by-format pricing benchmarks, and a breakdown of 2026 creative trends is live on the RichAds blog now. Check it out to understand video just as well as you know push and pop formats.